
Figures & data
Table 1. Contingency table showing the level of agreement between low or preserved breathing reserve (maximal voluntary ventilation estimated as FEV1 × 40) versus the presence of not of critical inspiratory constraints (end-inspiratory lung volume (EILV)/total lung capacity (TLC) ratio) or excess ventilation (ventilation (V̇E)/CO2 output (V̇CO2) ratio) in patients with COPD.
Table 2. Resting and exercise characteristics of COPD patients separated according to preserved or low breathing reserve (BR > or ≤20%, respectively) versus absence or presence of critical inspiratory constraints (end-inspiratory lung volume (EILV)/total lung capacity (TLC) ratio < or ≥0.9, respectively) at the peak of incremental cardiopulmonary exercise testing (CPET).
Figure 1. Metabolic (panel A), cardiovascular (panel B), ventilatory (panels C–E) and sensory (panel F) responses to symptom-limited incremental CPET in COPD patients presenting or not with a low breathing reserve (BR ≤ or >20%, respectively) and/or high inspiratory constraints (end-inspiratory lung volume (EILV)/total lung capacity (TLC) ≥ or <0.9, respectively). Commonly used ranges for severe physiological and sensory impairment are highlighted (shadow areas in panels C–F). The arrows in panels C, D and F emphasize the exercise intensity associated with a disproportionate increase in dyspnea relative to metabolic and ventilatory demand.
Note: p < 0.05. *versus the other groups; †versus the remaining groups. Data are mean ± SEM. O2= oxygen uptake, HR: heart rate, EELV: end-expiratory lung volume; VT: tidal volume, TLC: total lung capacity, V˙E: minute ventilation,V˙CO2: carbon dioxide output.
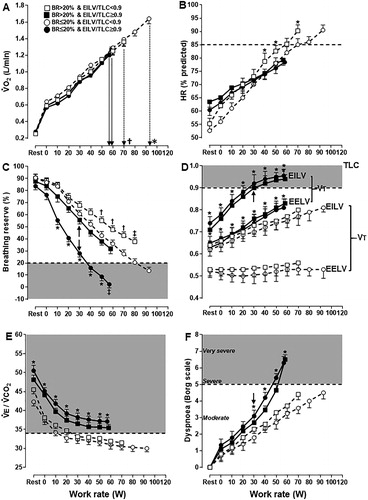
Figure 2. Distribution of COPD patients presenting or not with a higher dyspnea burden (peak dyspnea/work rate ratio > sample’s median (0.09 Borg unit/W) and peak dyspnea ≥ peak leg effort) relative to the breathing reserve (maximal voluntary ventilation = FEV1 × 40) and inspiratory constraints. Patients were separated by the presence or not of excess ventilation (high ventilation (V̇E)/CO2 output (V̇CO2) nadir). The dotted lines are the cut-offs for ventilatory limitation according to a low breathing reserve or critically high inspiratory constraints. The upper right shaded quadrant represents the patients with preserved breathing but critically high inspiratory constraints: the lower left shaded quadrant depicts the opposite.
Note: EILV: end-inspiratory lung volume; TLC: total lung capacity.
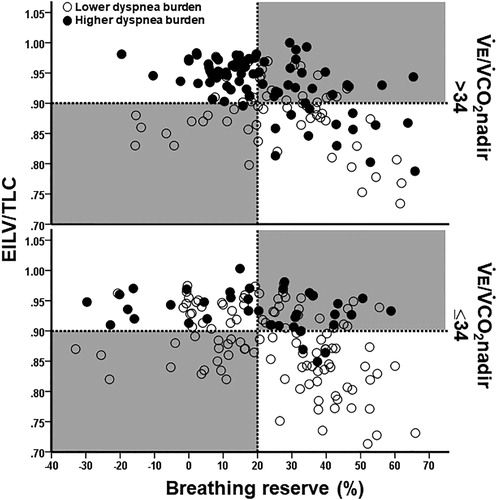
Figure 3. Distribution of COPD patients presenting or not with a lower exercise tolerance (peak O2 uptake < sample’s median (1.04 L/minutes) and <50% predicted) relative to the breathing reserve (maximal voluntary ventilation = FEV1 × 40) and inspiratory constraints. Patients were separated by the presence or not of excess ventilation (high ventilation (V̇E)/CO2 output (V̇CO2) nadir). The dotted lines are the cut-offs for ventilatory limitation according to a low breathing reserve or critically high inspiratory constraints. The upper right shaded quadrant represents the patients with preserved breathing but critically high inspiratory constraints: the lower left shaded quadrant depicts the opposite.
Note: EILV: end-inspiratory lung volume, TLC: total lung capacity.
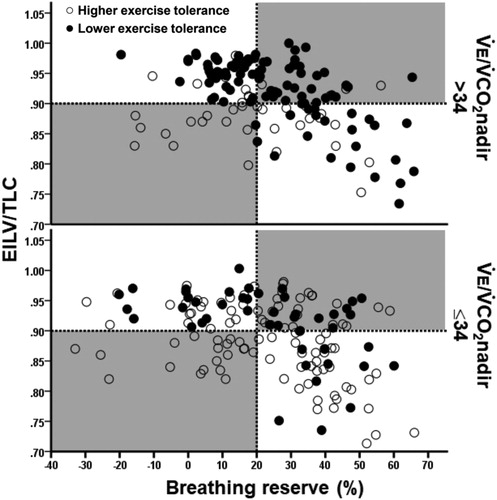
Table 3. Association between CPET-based negative outcomes (“higher” dyspnea burden = peak dyspnea/work rate ratio > sample’s median and peak dyspnea ≥ peak leg effort and/or “lower” exercise tolerance (peakV˙O2 < sample’s median and <50% predicted) with abnormal or preserved breathing reserve (maximal voluntary ventilation estimated as FEV1 × 40), end-inspiratory lung volume (EILV)/total lung capacity (TLC) and the nadir of ventilation (V̇E)/CO2 output (V̇CO2) ratio in patients with COPD.
Table 4. Final outcome of a multiple logistic regression analysis to predict the association of a high dyspnea burden (dyspnea/work rate ratio > study population’s median value and peak dyspnea ≥ leg effort scores) with a low peak O2 uptake (peakV˙O2 < sample’s median and <50% predicted) (Citation26).