
Figures & data
Table 1. Demographics, anthropometrics and lung function of patients with COPD and healthy controls.
Figure 1. Angular measurements performed with the arms at rest (left), arms parallel to the ground and at full shoulder flexion (right), showing the upper and lower thoracic spine angles (°) and shoulder ROM (°).
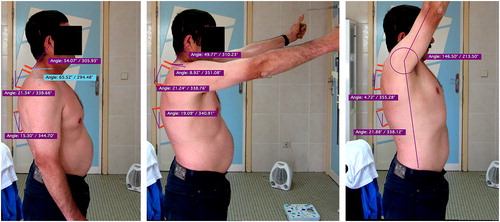
Table 2. Mean differences (±95% confidence intervals) in thoracic spine angles between patients with COPD and controls in the three arm elevation positions tested.
Table 3. Pearson's correlation coefficients (r) between head, thoracic spine and shoulder girdle measurements in the standing upright position and full range of arm elevation motion.