Figures & data
Table 1. Demographical and clinical characteristics of the three studied groups: patients with COPD, older healthy adults, and younger healthy adults.
Figure 1. Statokinesiogram for representative individual of each group in the vision and surface condition (COPD, older healthy adults and younger healthy adults); (A) fixed surface/full vision, (B) fixed surface/no vision, (C) sway-referenced surface/full vision, and (D) sway-referenced surface/no vision. The black line represents the full vision and the gray line no vision condition.
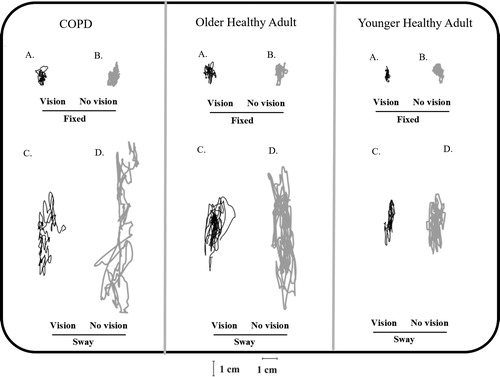
Table 2. Evaluation of the main effects and interactions for the center of pressure value among groups (COPD, older healthy adults and younger healthy adults) in different vision (vision and no vision) and surface conditions (fixed, sway-referenced).
Figure 2. Mean values (standard errors in vertical bars) of amplitude (AMP), root-mean-square (RMS) and mean velocity (MV) of CoP in both directions (anteroposterior, AP; mediolateral, ML), in conditions with support surface (fixed/sway-referenced) and vision (vision/no vision) variations, for all groups (COPD, older healthy adults and younger healthy adults). & age influence; ¶ disease influence.
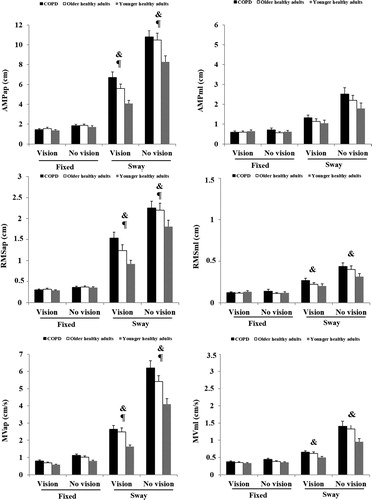
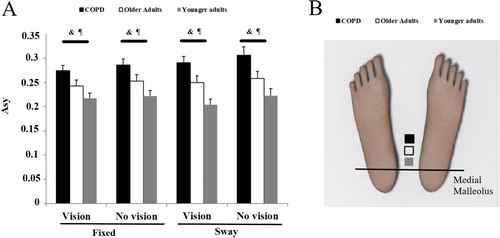
Figure 3. (A) Mean values (standard errors in vertical bars) of asymmetry (Asy) of CoP for groups (COPD, older healthy adults and younger healthy adults). (B) Schematic representation of CoP location for groups regarding the medial malleolus. The square is a schematic representation of the average of CoP location of each group. & age influence; ¶ disease influence.