
Figures & data
Table 1. Clinical and functional characteristics of the study population.
Figure 1. Changes in the distribution of the ABCD groups from GOLD 2011 to GOLD 2017 within the study cohort.
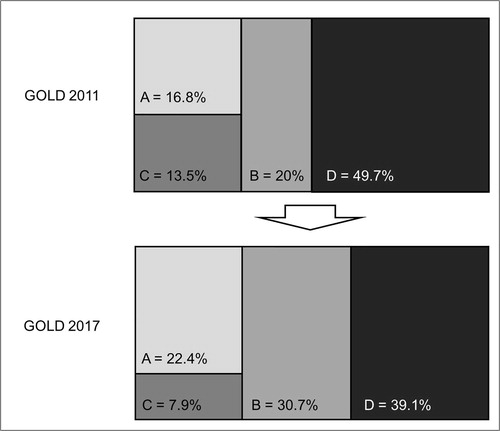
Figure 2. Box plot showing the distribution of the forced expiratory volume in 1 second according to the GOLD 2017 subgroups.
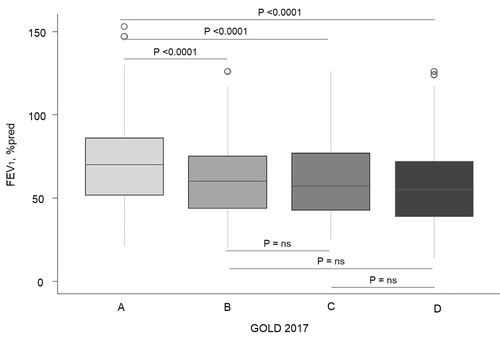
Figure 3. Box plot showing the distribution of the inspiratory capacity according to the GOLD 2007, GOLD 2011 and GOLD 2017 criteria.
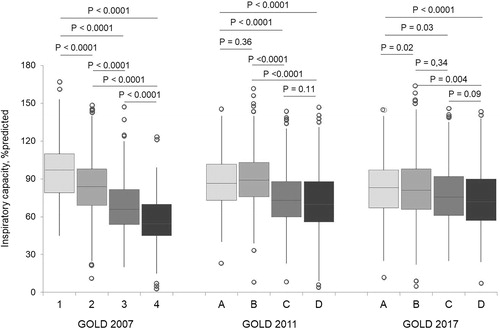
Figure 4. Box plot showing the distribution of the lung diffusion capacity (DLCO) according to the GOLD 2007, GOLD 2011 and GOLD 2017 criteria.
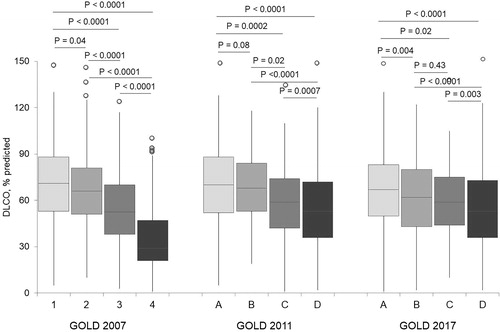
Figure 5. Box plot showing the distribution of the alveolar volume (VA) and transfer coefficient (KCO) according to the GOLD 2007 staging criteria.
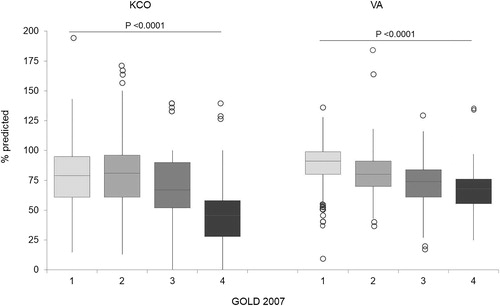
Figure 6. Distribution of the clinical COPD phenotypes (mixed = dark grey, emphysema = grey, and chronic bronchitis = light grey) according to the GOLD 2007, GOLD 2011 and GOLD 2017 criteria.
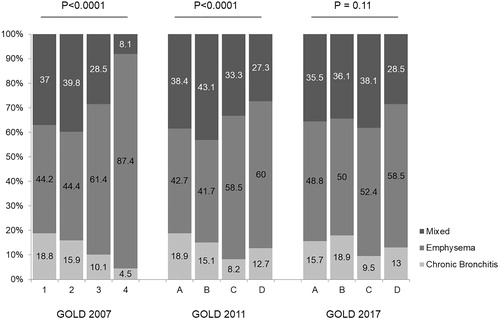
Table 2. Distribution of the eosinophil counts and inhaled treatments according to the different GOLD classifications.
Table 3. Distribution of the eosinophil counts according to the patients’ clinical phenotype.
Table 4. Inhaled treatment distribution in frequent and non-frequent exacerbations.
Data availability statement
The data are available upon request.