
Figures & data
Figure 1. Study flowchart.
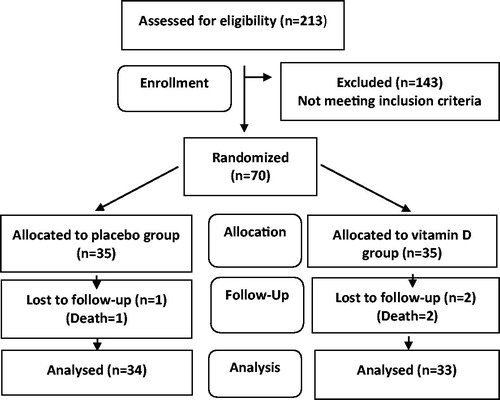
Table 1. Demographic and baseline characteristics of the recruited patients.
Table 2. Levels of systemic inflammatory biomarkers at baseline and day 6 in the study groups.
Table 3. Changes in the levels of the systemic biomarkers from the baseline through the 6th day and comparisons of changes between the groups.