
Figures & data
Figure 1. Study flow chart using data from the Korea National Health and Nutrition Examination Survey (KNHANES, 2013–2015).
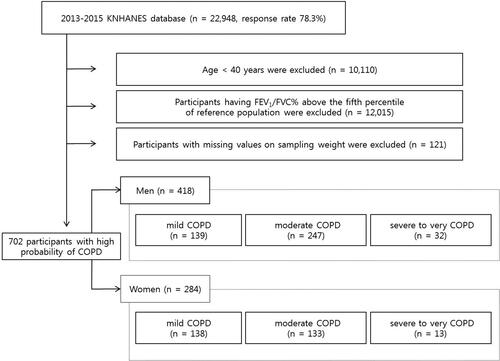
Table 1. General characteristics of study participants.
Table 2. Dietary macro-nutrient intake of the participants according to disease severity of COPD.
Table 3. Dietary micro-nutrient intake of the participants according to disease severity of COPD.
Table 4. Association between predicted FEV1% and nutrient intake in men (n = 418).
Table 5. Association between predicted FEV1% and nutrient intake in women (n = 284).
Table 6. Association between predicted FEV1% and nutrient intake in elderly men (n = 254).
Table 7. Association between predicted FEV1% and nutrient intake in elderly women (n = 133).