
Figures & data
Figure 1. Distribution of FeNO with respect to blood eosinophils.
Notes: The coordinate axes are expressed as logarithms of the corresponding data. Although a significant association between FeNO and blood eosinophils was seen (Pearson correlation coefficient r = 0.192, P < 0.001), use of the cutoff of 200 cells/μL or more blood eosinophils (horizontal line) to predict FeNO of at least 25 ppb (vertical line) will mistakenly identify many patients with lower FeNO (upper left quadrant) and miss many patients with actual FeNO of 25 ppb or more (lower right quadrant).
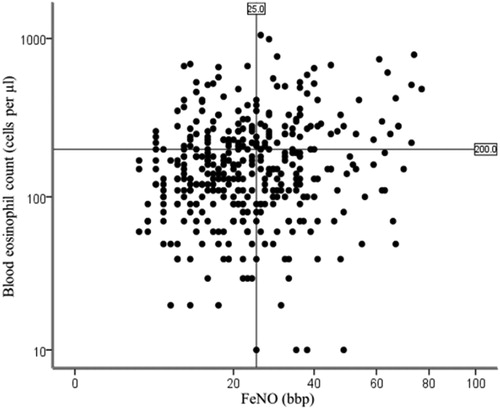
Table 1. Demographics for patients stratified by the mean FeNO or blood eosinophil counts at baseline.
Table 2. Clinical characteristics for patients stratified by the mean FeNO or blood eosinophil counts.
Figure 2. Receiver operating characteristic analysis for blood eosinophil prediction of FeNO.
Notes: A: Correct prediction of FeNO less than 25 ppb or more. AUC = 0.565 (95% CI 0.506–0.623, P = 0.028); B: Correct prediction of FeNO less than 30 ppb or more AUC = 0.560 (95% CI 0.495–0.625, P = 0.060).
Abbreviations: AUC, area under the curve.
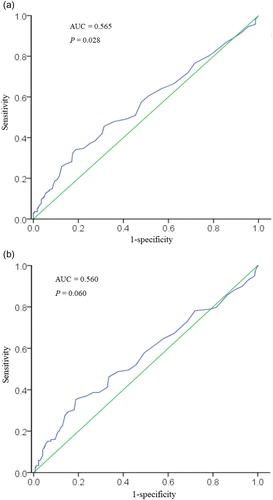
Table 3. Lung function and exacerbations for patients in groups stratified by FeNO and blood eosinophil counts.
Table 4. Adjusted relative impact of groups stratified by FeNO on moderate or severe exacerbation in preceding 12 months.