Figures & data
Figure 1. Study design flow-chart and patients selection.
ARF: acute respiratory failure; AECOPD: acute exacerbation chronic obstructive pulmonary disease; HRCT: high resolution computed tomography; RR: respiratory rate; NIV: noninvasive ventilation; ED: emergency department; HFNT: high flow nasal cannula; ABG: arterial blood gas analysis; VAS: visual analogic scale.
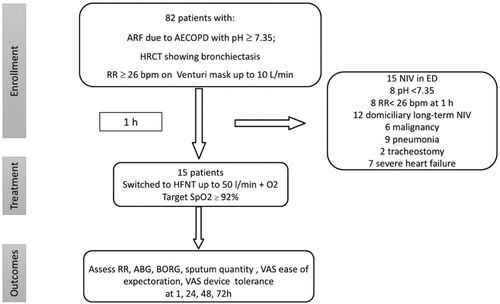
Table 1. Patients’ characteristics.
Table 2. Bronchiectasis details.
Figure 2. Changes of RR, BORG scale, pO2, pCO2 at baseline and at different time points during HFNT treatment. RR: respiratory rate; HFNT: high flow nasal therapy.
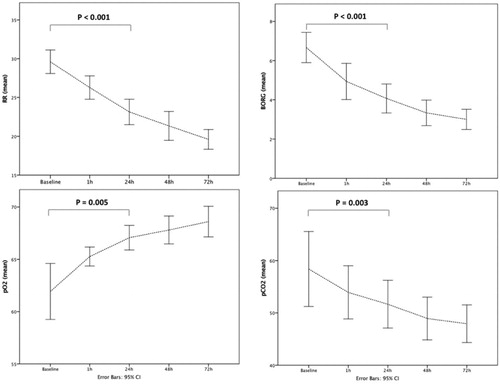
Table 3. Assessment of study outcomes at the different time-points.
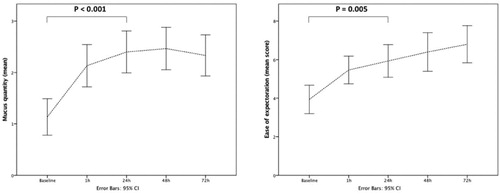
Figure 3. Changes of mucus production and patients’ self-reported ease of sputum expectoration at baseline and at different time points during HFNT.