
Figures & data
Table 1. Subjects demonstration.
Table 2. Univariate severe obstructive sleep apnea predictors: (using an AHI cutoff value of 30 h-1).
Table 3. Logistic regression analysis: factors associated with an apnea-hypopnea index ≥30/h as determined by X2 automatic interaction detection analysis.
Table 4. OSA screening questionnaire.
Table 5. Diagnostic performance of OSA sleep questionnaire at a variety of AHI diagnostic criterion values in development group.
Figure 1. Receiver operating characteristic curve showing the performance of the OSA screening questionnaire, using a cutoff value of ≥ 2/5 (blue line) or ≥ 3/5 (pink line) in discriminating patients with severe OSA (AHI ≥ 30/h) in the development group (n = 77) and validation group (n = 78). AUC, area under the ROC curve.
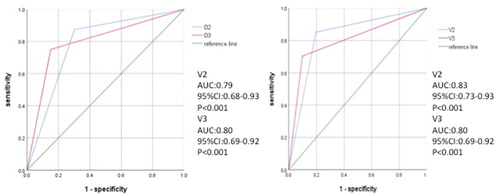
Table 6. Diagnostic performance of OSA sleep questionnaire at a variety of AHI diagnostic criterion values in validation group.
Table 7. Diagnostic performance of OSA sleep questionnaire at a variety of COPD severity, AHI ≥ 30.