
Figures & data
Table 1. Baseline characteristics (n = 69).
Figure 1. Scatterplot of sedentary time against moderate-vigorous intensity physical activity (MVPA), stratified by sedentariness (sedentary time ≥70% of waking wear time) and physical activity levels (MVPA ≥30 min/day). Of the 69 participants, 57% were classified as “sedentary” and 43% as “non-sedentary”; 41% were classified as “inactive” and 59% as “active”. Solid circles: 6MWD <80% predicted; blank circles: 6MWD ≥80% predicted.
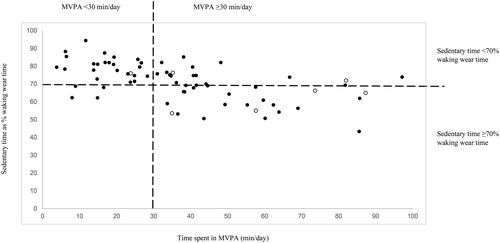
Figure 2. Proportions of waking wear time spent in sedentary behaviour, standing and physical activity.
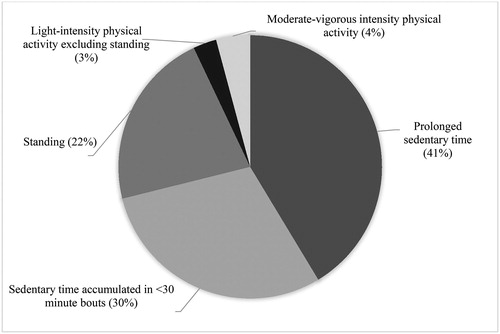
Table 2. Patterns of sedentary behaviour accumulation and physical activity (n = 69).
Figure 3. Correlation of sedentary time expressed as a proportion of waking wear time with time spent in light activities. Solid circles: 6MWD <80% predicted; blank circles: 6MWD ≥80% predicted.
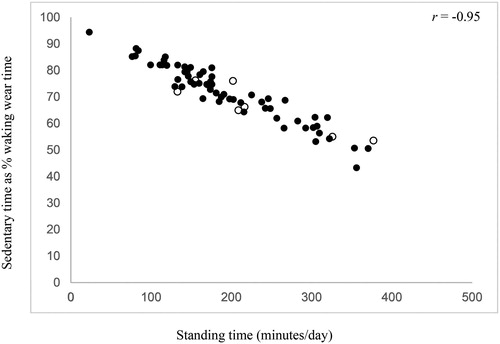
Table 3. Physiological and functional capacity correlates of total sedentary behaviour and patterns of sedentary behaviour accumulation.