
Figures & data
Table 1. Subject demographics reported as mean (standard deviation).
Figure 1. Mean (top), standard deviation (middle), and coefficient of variation (bottom) of interbreath intervals (left) and tidal volume (right) during all three postures for controls (gray) and patients with COPD (white). Significant post-hoc comparisons are identified by symbols: asterisk (*) indicates difference from COPD standing; carrot (∧) indicates difference from control walking; and hashtag (#) indicates difference from COPD walking. All pairwise comparisons were significant at p 0.03. Bolded symbols indicate significance at p
0.001. Note: Plotted data are original values and not transformed.
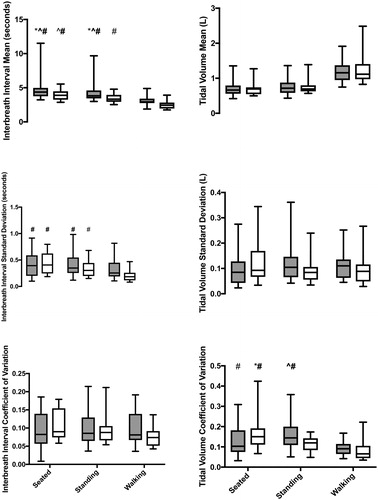
Figure 2. Overall airflow regularity during each posture for controls (gray) and patients with COPD (white). Significant pairwise comparisons to walking by controls and by patients with COPD are shown by an asterisk (*) and carrot (∧), respectively. All pairwise comparisons were significant at p 0.001.
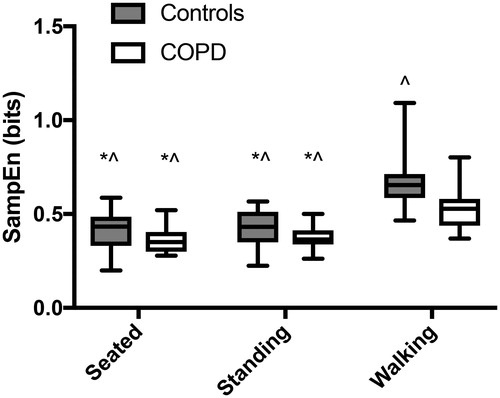
Figure 3. Length of time to reach steady state VO2 for both controls (gray) and patients with COPD (white) for all three postures. Significant pairwise comparisons to the time of steady state onset in patients with COPD while walking, are indicated by an asterisk (*). All pairwise comparisons were significant at p 0.001.
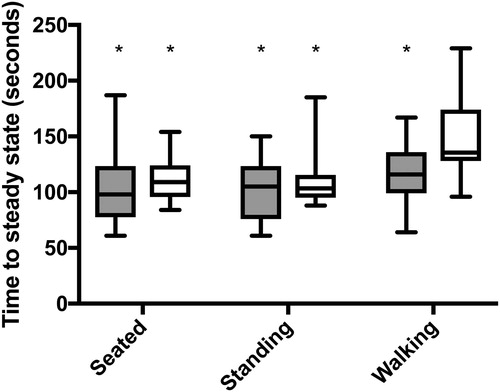
Figure 4. Regularity of airflow during the rise to (solid) and after (pattern) the onset of steady state VO2. All three postures are shown for controls (gray) and patients with COPD (white). Significant post-hoc comparisons are identified by symbols: dot (•) indicates difference from COPD standing at steady state; asterisk (*) indicates difference from COPD walking rise to steady state; carrot (∧) indicates difference from COPD walking at steady state; and hashtag (#) indicates difference from control walking at steady state. All pairwise comparisons were significant at p 0.01 with the exception of the standing comparison (p = 0.04).
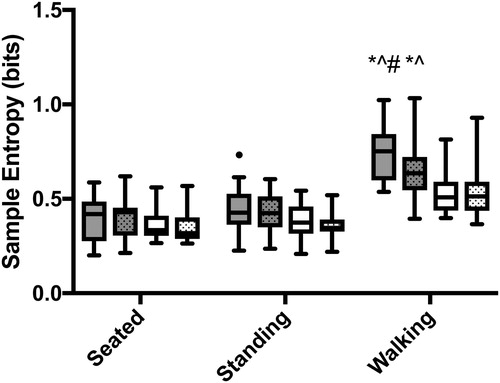
Table 2. ANOVA results for regularity of airflow between groups, postures, and timing. Timing was divided into prior to and just after the onset of steady state VO2. Bold values are significant. Partial eta2 (η2) are also shown.