
Figures & data
Table 1. Patient characteristics.
Figure 1. Pulmonary rehabilitation completion rates between frequent and infrequent exacerbators. Data presented as % of group to attend 12 or more pulmonary rehabilitation classes. *Significant difference between groups (p < 0.05).
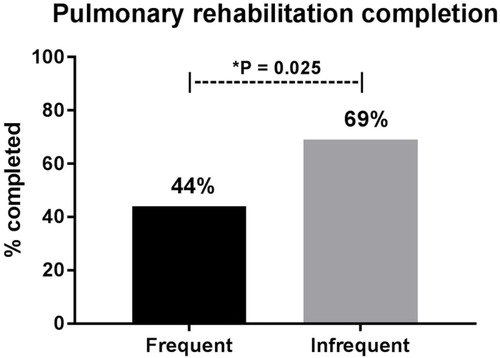
Table 2. Clinical outcomes following pulmonary rehabilitation.
Figure 2. Fibrinogen concentrations in response to pulmonary rehabilitation in frequent and infrequent exacerbators. *Significant overall main effect of time between pre- and post-rehabilitation (p < 0.05).

Table 3. Blood cell counts pre- and post-pulmonary rehabilitation.