Figures & data
Table 1. The primers for real-time PCR.
Figure 1. Cigarette smoke induced CD147 expression in murine lung tissue and HBE cells. (a, b) CD147 mRNA (a) and protein (b) expression in murine lung tissue; (c, d) CD147 mRNA (c) and protein (d) expression in HBE cells treated by CSE ranged from 0–10%; (e, f) CD147 mRNA (e) and protein (f) expression in HBE cells treated by 10% CSE for 0–48 h. (animal study was performed with six replicates in each group, and cell experiments were performed in triplicates, *p < 0.05; **p < 0.01; ***p < 0.001, compared with CON or 0).
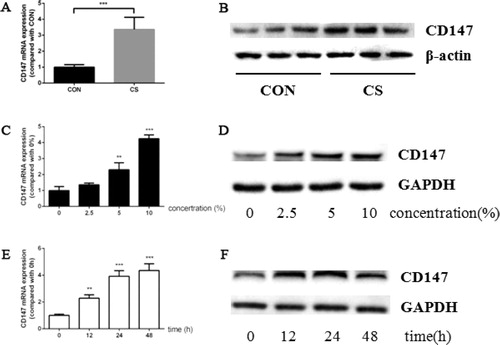
Figure 2. Cigarette smoke upregulated α-SMA, Vimentin expression and downregulated Ecadherin, ZO1 expression both in vivo and in vitro. (a–d) Ecadherin (a), α-SMA (b), ZO1 (c) and Vimentin (d) mRNA expression in murine lung tissue; (e) representative pictures of Ecadherin (left panel), α-SMA (middle left panel), ZO1 (middle right panel) and Vimentin (right panel) protein expression in murine lung tissue by IHC (scale bar, 50 μm); (f–i) Ecadherin (f), α-SMA (g), ZO1 (h) and Vimentin (i) mRNA expression in HBE cells treated by CSE in a series of concentrations; (j–m) Ecadherin (j), α-SMA (k), ZO1 (l) and Vimentin (m) mRNA expression in HBE cells treated by 10% CSE for 0–48 h; (n, o) Ecadherin, α-SMA, ZO1 and Vimentin protein expression in HBE cells treated by CSE in a series of concentrations (n) or 10% CSE for 0–48 h (o). (Animal study was performed with six replicates in each group, and cell experiments were performed in triplicates, *p < 0.05; **p < 0.01; ***p < 0.001, compared with CON or 0).
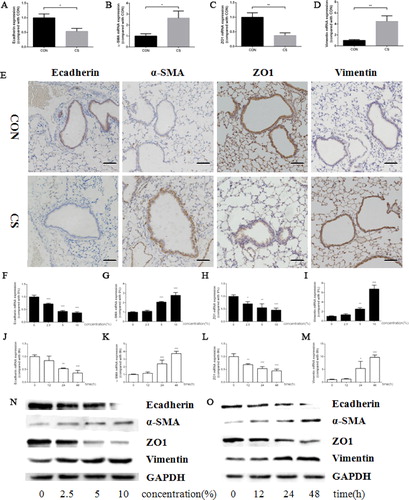
Figure 3. The effect of CD147 knockdown on CSE induced EMT markers expression in HBE cells. (a–d) Ecadherin (a), α-SMA (b), ZO1 (c) and Vimentin (d) mRNA expression in HBE cells transfected with control or CD147 siRNA and then treated by 10% CSE for 48 h; (e) Ecadherin, α-SMA, ZO1 and Vimentin protein expression in HBE cells transfected with control or CD147 siRNA and then treated by 10% CSE for 48 h; (f) representative images of Ecadherin (left panel), α-SMA (middle left panel), ZO1 (middle right panel) and Vimentin (right panel) protein expression in HBE cells by IF (All analyses were performed in triplicates, *p < 0.05; **p < 0.01; ***p < 0.001).
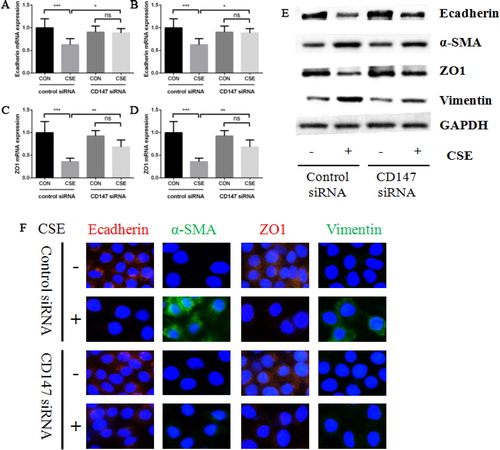
Figure 4. Cigarette smoke induced oxidative stress response in vivo and in vitro. (a) representative pictures of 8-OHdG expression in murine lung tissue by IHC (scale bar, 50 μm); (b) HO1, GSTP, NQO1 and GCLC mRNA expression in murine lung tissue; (c) relative H2O2 production in culture medium in HBE cells treated by 10% CSE for 24 h; (d) mean flurescence intensity (MFI) of intracellular ROS treated by 10% CSE for 24 h; (e–h) HO1 (e), GSTP (f), NQO1 (g) and GCLC (h) mRNA expression in HBE cells treated by 10% CSE (animal study was performed with six replicates in each group, -and cell experiments were performed in triplicates, *p < 0.05; **p < 0.01; ***p < 0.001, compared with CON or 0).
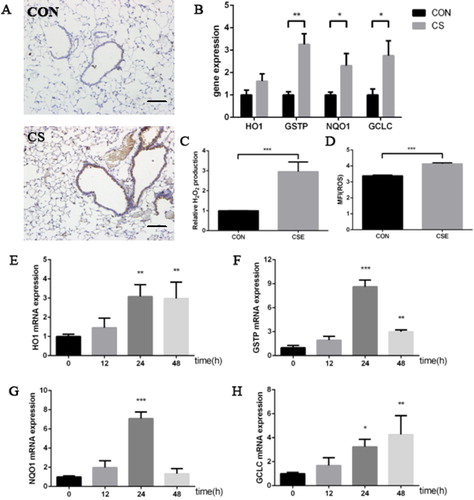
Figure 5. Oxidative stress was involved in cigarette smoke induced EMT process. (a, b) the effect of NAC (a) or H2O2 (b) on Ecadherin mRNA expression in HBE cells treated by 10% CSE for 48 h; (c, d) the effect of NAC (c) or H2O2 (d) on α-SMA mRNA expression in HBE cells treated by 10% CSE for 48 h; (e, f) The effect of NAC (e) or H2O2 (f) on ZO1 mRNA expression in HBE cells treated by 10% CSE for 48 h; (g, h) the effect of NAC (g) or H2O2 (h) on Vimentin mRNA expression in HBE cells treated by 10% CSE for 48 h; (i, j) the effect of NAC (i) or H2O2 (j) on Ecadherin, α-SMA, ZO1 and Vimentin protein expression in HBE cells treated by 10% CSE for 48 h. (All analyses were performed in triplicates, *p < 0.05; **p < 0.01; ***p < 0.001).
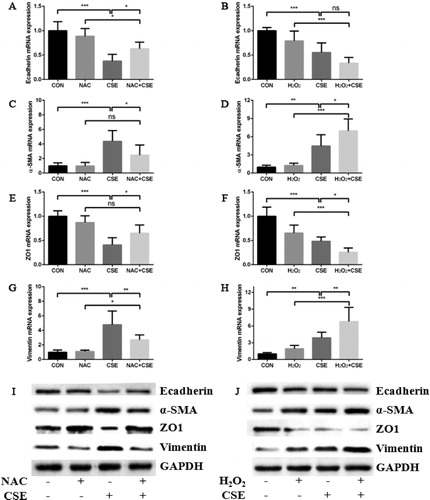
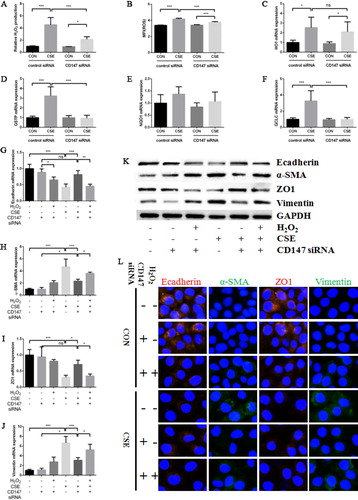
Figure 6. Cigarette smoke promoted EMT in HBE cells via oxidative stress signal pathway. (a) Relative H2O2 production in culture medium in HBE cells transfected with control or CD147 siRNA and then treated by 10% CSE for 24 h; (b) mean flurescence intensity (MFI) of intracellular ROS in HBE cells transfected with control or CD147 siRNA and then treated by 10% CSE for 24 h; (c–f) HO1 (c), GSTP (d), NQO1 (e) and GCLC (f) mRNA expression in HBE cells transfected with control or CD147 siRNA and then treated by 10% CSE for 24 h; (g–j) Ecadherin (g), α-SMA (h), ZO1 (i) and Vimentin (j) mRNA expression in HBE cells transfected with control or CD147 siRNA and then treated by 10% CSE for 48 h with or without preincubation of 0.5 mM H2O2; (k) Ecadherin, α-SMA, ZO1 and Vimentin protein expression in HBE cells transfected with control or CD147 siRNA and then treated by 10% CSE for 48 h with or without preincubation of 0.5 mM H2O2. (l) Representative IF images of Ecadherin (left panel), α-SMA (middle left panel), ZO1 (middle right panel) and Vimentin (right panel) protein expression in HBE cells transfected with control or CD147 siRNA and then treated by 10% CSE for 48 h with or without preincubation of 0.5 mM H2O2. (All analyses were performed in four replicates, *p < 0.05; **p < 0.01; ***p < 0.001).