
Figures & data
Figure 1. (A) Scatterplot of individual data of the neutrophil/lymphocyte ratio (NLR) according to the diagnosis of ACO. Dotted lines correspond to the normal reference values. (B) Scatterplot of individual data the platelet/lymphocyte ratio (PLR) according to the diagnosis of ACO. Dotted lines correspond to the normal reference values.
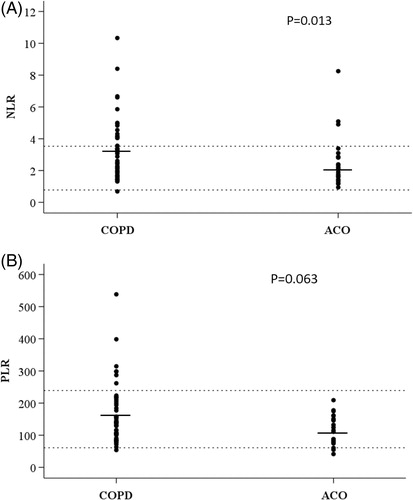
Table 1. Demographic and clinical characteristics of ACO patients and the remaining COPD patients.
Table 2. Laboratory findings of ACO patients and the remaining COPD patients.