Figures & data
Table 1. Selection of GEO datasets for chronic obstructive pulmonary disease.
Figure 1. Flow diagram of the study design. COPD: Chronic Obstructive Pulmonary Disease; GEO: Gene Expression Omnibus.
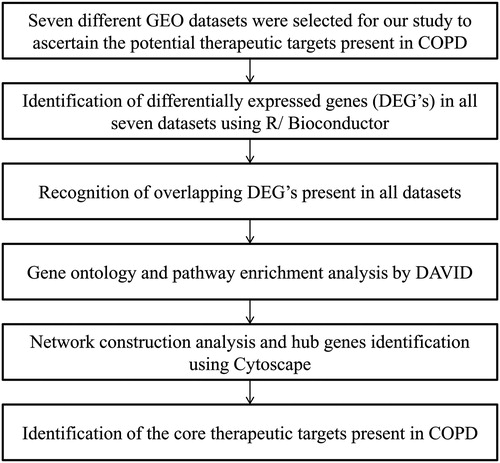
Table 2. The 188 overlapping genes were identified between each of the seven datasets.
Table 3. List of consistently repeated genes recognized between different combinations of GEO datasets.
Figure 2. The top ten enriched gene ontology terms of filtered differentially expressed genes where the x-axis represents the gene count and the y-axis represents the gene ontology terms of functional groups.
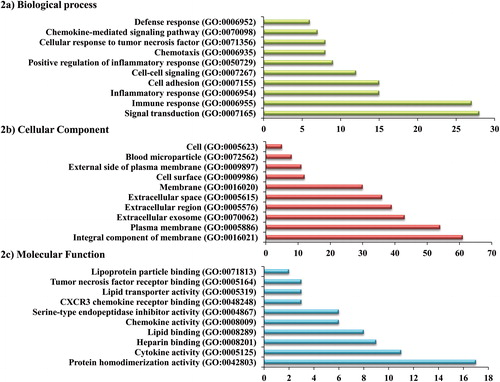
Figure 3. Protein–protein interaction network of filtered differentially expressed genes using Cytoscape software.
Two significant sub-networks (Module 1 & 2) were identified using the MCODE plugin. Nodes in dark blue color represent the DEG-encoded proteins of module 1, a node in red color represents the DEG-encoded protein of module 2, and nodes in green color represent the overlapped proteins between module 1 and 2.
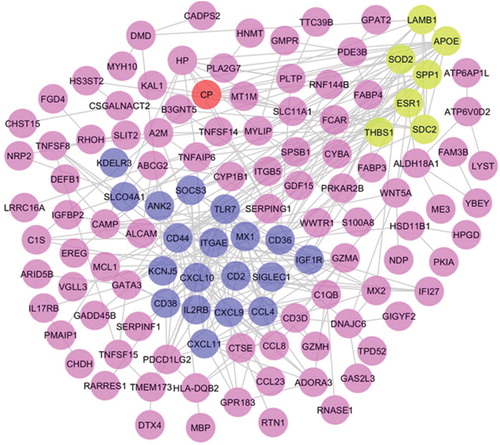
Figure 4. Topological properties of the central network (a) Average clustering coefficient, (b) Degree distribution of proteins, (c) Shortest path length distribution, (d) Topological coefficients.
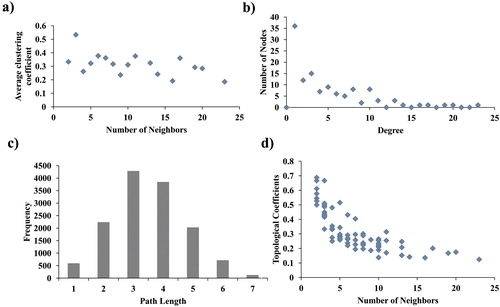
Table 4. Top 20 hub proteins identified using different algorithms by cytoHubba plugin.
Figure 5. Role of chemokine receptors in COPD.
Innate immune cells such as macrophages, neutrophils, dendritic cells, CD4+ and CD8+ T lymphocytes express chemokines. The function of the chemokines is divided into two parts: Inflammatory and Homeostatic. The cc chemokine (CCL4) ligand attracts immune cells to inflammatory sites by involving in inflammatory response whereas the CXCR3 chemokine receptors (CXCL9, CXCL10, and CXCL11) participates in the cell migration during tissue development. The chemokine ligands CXCL9, CXCL10, and CXCL11 binds to the CXCR3 receptor and induced on activated T-helper (Th) 1 cell and CD8+ T lymphocytes at the sites of inflammation and leads to lung damage which eventually results in COPD. The CCL4 ligand from CCR5 receptor stimulates IL-2 and IFN-γ which causes severe airflow limitation and leads to COPD.
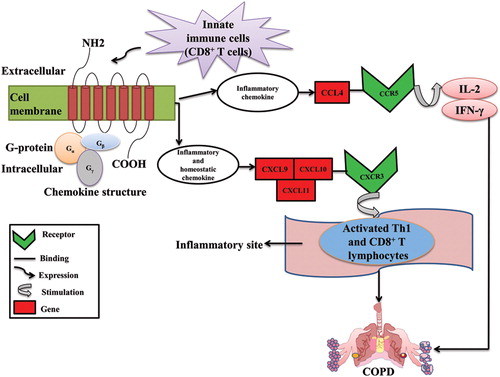
Figure 6. Toll-like receptor 7 signaling and role of osteopontin in COPD.
Plasmacytoid dendritic cells express TLR7 from the endosomal compartment which recognizes single-stranded RNA from viruses and signals the adaptor molecule MyD88 in the presence of a ligand. TLR7-MYD88 complex activates IRAK4 in its death domain which phosphorylates and activates IRAK1. The activated IRAK1 recruits TRAF6 and mediated IRF7 activation upon phosphorylation by initiating innate immune responses. IKK-α and OPN are critically involved in IRF7 activation and type I interferon production because insufficient osteopontin expression leads to defective nuclear translocation of IRF7 in plasmacytoid dendritic cells. These TLR7 signaling finally leads to the release of inflammatory cytokines/type I interferons and results in COPD.
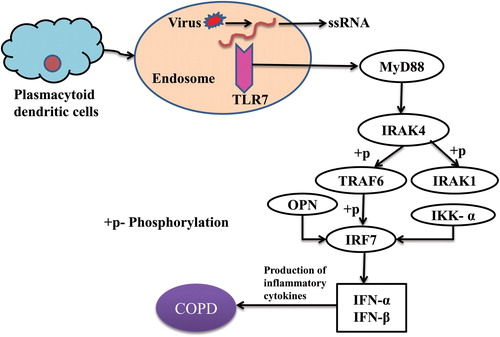
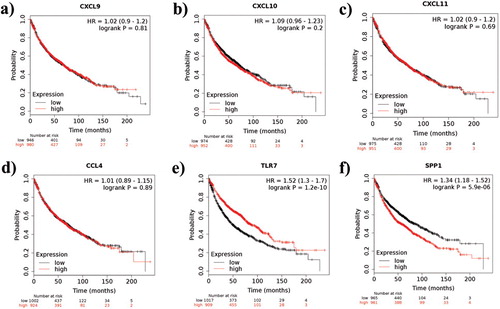
Figure 7. Kaplan-Meier survival analysis of the obtained six hub genes. Prognostic value of (a) CXCL9, (b) CXCL10, (c) CXCL11, (d) CCL4, (e) TLR7, and (f) SPP1 were evaluated using the Kaplan-Meier plotter. Black represents genes with low expression values and red represents genes with high expression values.