
Figures & data
Table 1. Patient characteristics.
Figure 1. Representative flow cytometric analyses for peripheral blood circulating monocytes. Cells obtained from the peripheral blood monocytes (PBMCs) were used for analyses, and doublets and debris were excluded. Representative plots illustrate the gating strategy in samples obtained from COPD patients. (Top). CD14+CD16−—classical monocytes, CD14+CD16+—intermediate monocytes, and CD14diminishCD16+—alternative monocytes were identified. (Bottom left and right). Dot plots represent isotype controls and primary antibodies against S100A9 and CD163 in classical monocytes.
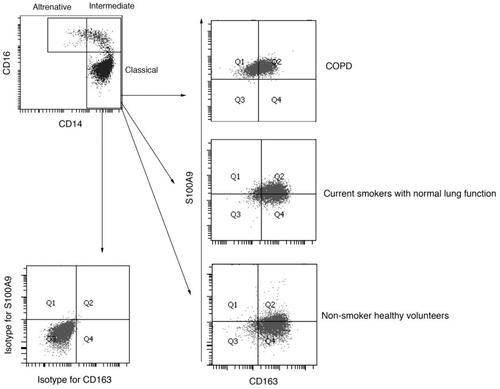
Table 2. Impact of background factors on cell polarization of circulating classical monocytes.
Figure 2. Rates of S100A9+ and CD163+ circulating classical monocytes in three groups. (A). Rates of S100A9+ monocytes (Gate 1 + 2). (B). Rates of S100A9+CD163− monocytes (Gate 1). (C). Rates of S100A9+CD163+ monocytes (Gate 2). (D). Rates of CD163+ monocytes (Gate 2 + 4). (E). Rates of S100A9−CD163+ monocytes (Gate 4). (F). Ratios of S100A9+/CD163+ monocytes (Gate 1/Gate 4). LFT: lung function tests. ∗ p < 0.05, ∗∗ p < 0.01, and ∗∗∗ p < 0.001.
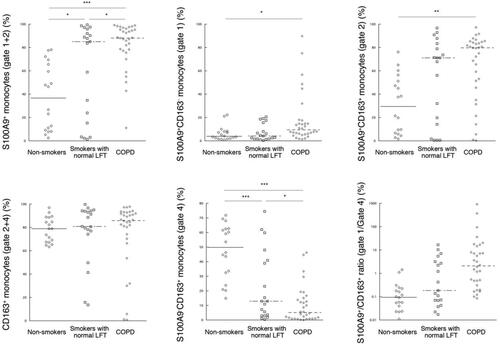
Figure 3. Receiver operating characteristic (ROC) curve analysis to assess the diagnostic validity of the ratio of S100A9+CD163−/S100A9−CD163+ cells in circulating classical monocytes in discriminating COPD patients from current smokers with normal lung functions. The area under the curve (AUC) was 0.719 (p < 0.01, 95% confidence interval [CI] = 0.567–0.871) for the diagnoses of COPD.
![Figure 3. Receiver operating characteristic (ROC) curve analysis to assess the diagnostic validity of the ratio of S100A9+CD163−/S100A9−CD163+ cells in circulating classical monocytes in discriminating COPD patients from current smokers with normal lung functions. The area under the curve (AUC) was 0.719 (p < 0.01, 95% confidence interval [CI] = 0.567–0.871) for the diagnoses of COPD.](/cms/asset/6caefc7b-fa3e-46e1-9898-e6415e0ee9d3/icop_a_1793925_f0003_b.jpg)
Table 3. Univariate and multivariate logistic regression analyses for COPD diagnoses discriminating from smokers with normal lung functions.
Table 4. Specificity, sensitivity, and threshold values of each parameter with area under the receiver operating characteristic.