Figures & data
Figure 1. Timeline of the study. mo: month; C1: control group 1 month (10 animals); S1: smoke group 1 month (10 animals); C3: control group 3 months (10 animals); S3: smoke group 3 months (10 animals); C6: control group 6 months (10 animals); S6: smoke group 6 months (10 animals); PS: provisional smoking group (6 animals).
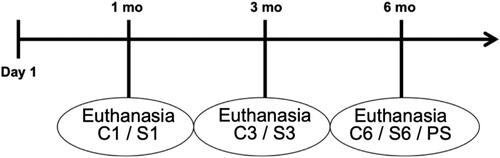
Figure 2. Cigarette smoke exposure chamber.
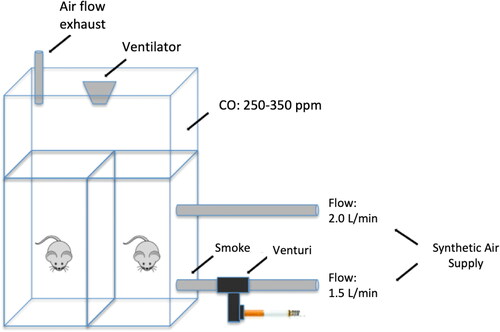
Table 1. Data of body weight of each group are shown as mean and standard deviation.
Figure 3. Extracted tissues (femur, tibia and lung). The dissected bones were completely clean from the surrounding tissues to avoid interference in gene expression analysis.
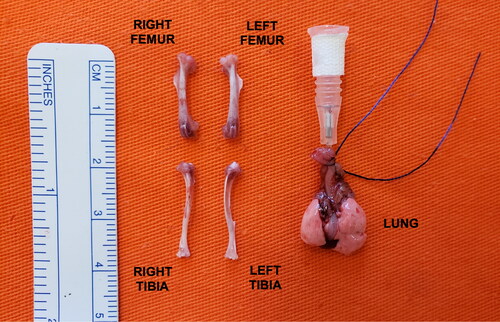
Table 2. Oligonucleotides employed for quantitative qRT-PCR.
Figure 4. Airway resistance assessment (Raw). Statistical analyses were performed with double factor analysis of variance test (ANOVA) in A, B and C; and one-way ANOVA test in D. The data are shown as mean and standard deviation (Control: 1 mo, n = 10; 3 mo, n = 10; 6 mo, n = 7. Smoke: 1 mo, n = 9; 3 mo, n = 8; 6 mo, n = 10. PS: n = 4). PS: provisional smoke. mo: month.
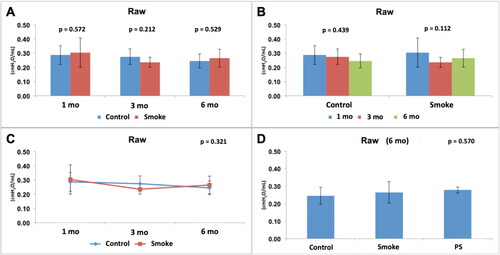
Figure 5. Assessment of lung tissue resistance (Gtis). Statistical analyses were performed with double factor analysis of variance test (ANOVA) in A, B and C; and one-way ANOVA test in D. The data are shown as mean and standard deviation (Control: 1 mo, n = 10; 3 mo, n = 10; 6 mo, n = 7. Smoke: 1 mo, n = 9; 3 mo, n = 8; 6 mo, n = 10. PS: n = 4). PS: provisional smoke. mo: month. *Statistically significant difference present in the Bonferroni post-test.
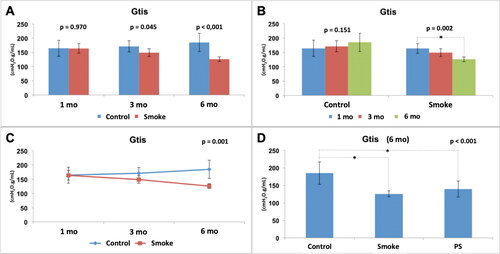
Figure 6. Assessment of lung tissue elastance (Htis). Statistical analyses were performed with double factor analysis of variance test (ANOVA) in A, B and C; and one-way ANOVA test in D. The data are shown as mean and standard deviation (Control: 1 mo, n = 10; 3 mo, n = 10; 6 mo, n = 7. Smoke: 1 mo, n = 9; 3 mo, n = 8; 6 mo, n = 10. PS: n = 4). PS: provisional smoke. mo: month. *Statistically significant difference present in the Bonferroni post-test.
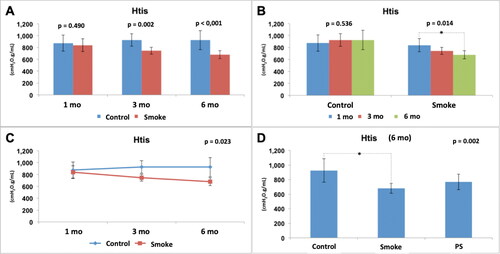
Figure 7. Histological assessment of the mean linear intercept (Lm). Statistical analyses were performed with double factor analysis of variance test (ANOVA) in A, B and C; and one-way ANOVA test in D. The data are shown as mean and standard deviation (Control: 1 mo, n = 10; 3 mo, n = 10; 6 mo, n = 7. Smoke: 1 mo, n = 9; 3 mo, n = 8; 6 mo, n = 10. PS: n = 4). PS: provisional smoke. mo: month. *Statistically significant difference present in the Bonferroni post-test.
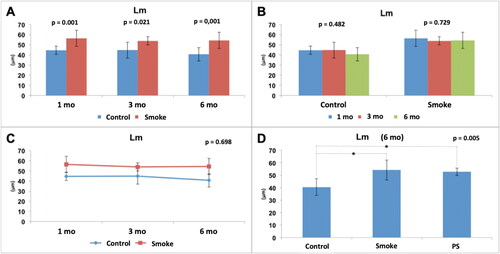
Figure 8. Immunofluorescence staining for type I collagen shows a uniform labeling pattern for collagen identified by the intense bright green fluorescence in the trabecular bone (arrows) of control groups with a slight decrease in 6 months compared with 1 and 3 months (A, C and E) and a marked decrease of fluorescence in smoke groups (B, D and F). mo: month.
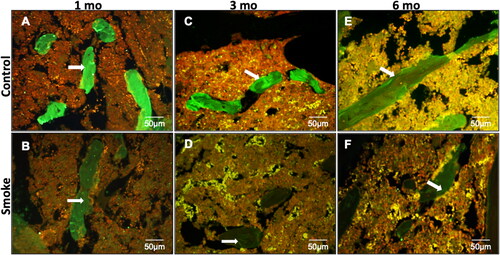
Figure 9. Immunohistochemical assessment of type I collagen fibers. Statistical analyses were performed with Mann-Whitney test in A and Kruskal-Wallis test in B. Results are presented as an average percentage of type I collagen in relation to the total area of the trabeculae. The data are shown as median and interquartile range IQ (25 - 75%). (Control: 1 mo, n = 10; 3 mo, n = 10; 6 mo, n = 7. Smoke: 1 mo, n = 9; 3 mo, n = 8; 6 mo, n = 10). mo: month. *Statistically significant difference present in the Dunn post-test.
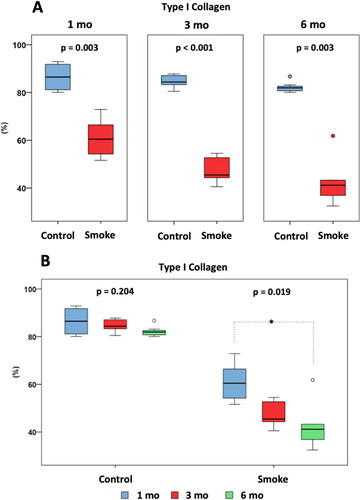
Figure 10. Immunohistochemical assessment of type I collagen fibers among the groups at 6 months of follow-up (C6, S6 and PS). Statistical analyses were performed with one-way ANOVA test. Results are presented as an average percentage of type I collagen in relation to the total area of the trabeculae. The data are shown as mean and standard deviation (Control: 6 mo, n = 7. Smoke: 6 mo, n = 10. PS: n = 4). PS: provisional smoke. mo: month. *Statistically significant difference present in the Bonferroni post-test.
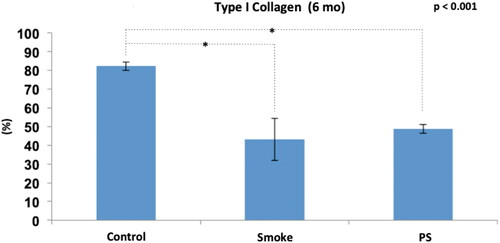
Figure 11. Assessment of COL1A1 gene expression. Statistical analyses were performed with Mann-Whitney test in A and Kruskal-Wallis test in B. The data are shown as median and interquartile range IQ (25 - 75%). (Control: 1 mo, n = 10; 3 mo, n = 10; 6 mo, n = 7. Smoke: 1 mo, n = 9; 3 mo, n = 8; 6 mo, n = 10). mo: month. a.u.: arbitrary unit.
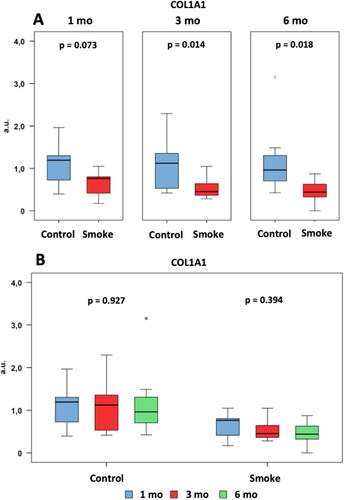
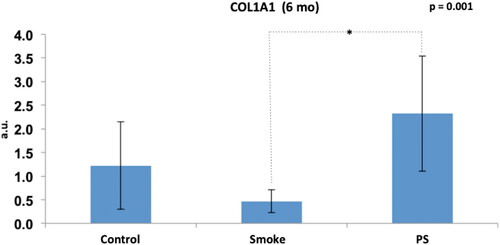
Figure 12. Assessment of COL1A1 gene expression among the groups at 6 months of follow-up (C6, S6 and PS). Statistical analyses were performed with one-way ANOVA test. The data are shown as mean and standard deviation (Control: 6 mo, n = 7. Smoke: 6 mo, n = 10. PS: n = 4). PS: provisional smoke. mo: month. a.u.: arbitrary unit. *Statistically significant difference present in the Bonferroni post-test.