
Figures & data
Figure 1. Flowchart of study design and process.
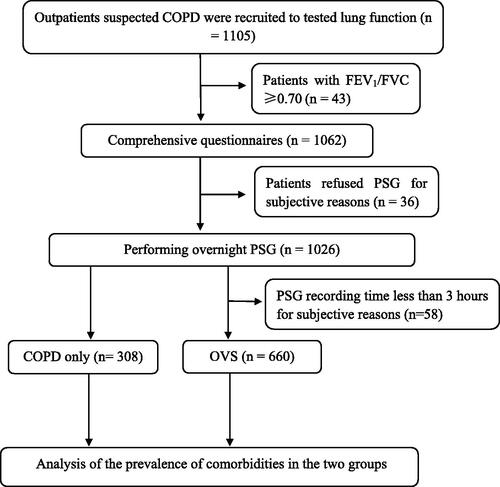
Table 1. Patients’ baseline characteristics, sleep data, scores and comorbidities of the COPD only group and the OVS group.
Figure 2. The prevalence of hypertension increased with the increasing severity of OSA. A Chi-square test indicated that the prevalence of hypertension increased with the OSA severity (χ 2 = 19.364, p < 0.0001). There were no significant relationships between OSA severity and diabetes (χ 2 = 2.292, p = 0.541), coronary heart disease (χ 2 = 1.743, p = 0.628), arrhythmia (χ 2 = 3.398, p = 0.334) or cerebrovascular disease (χ 2 = 4.895, p = 0.182).
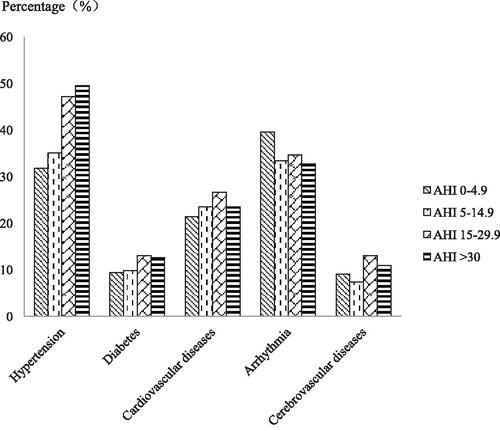
Table 2. Prevalence rates of five comorbidities in COPD patients according to AHI (events/hour).
Figure 3. The prevalence of arrhythmia increased with the increasing severity of airflow limitation. A χ 2 test indicated that the prevalence of arrhythmia increased with the airway limitation severity (χ 2 = 30.835, p < 0.0001). There were no significant relationships between the varying degrees of airway limitation and hypertension (χ 2 = 5.271, p = 0.153), diabetes (χ 2 = 3.022, p = 0.388), coronary heart disease (χ 2 = 5.297, p = 0.151) or cerebrovascular disease (χ 2 = 1.245, p = 0.182).
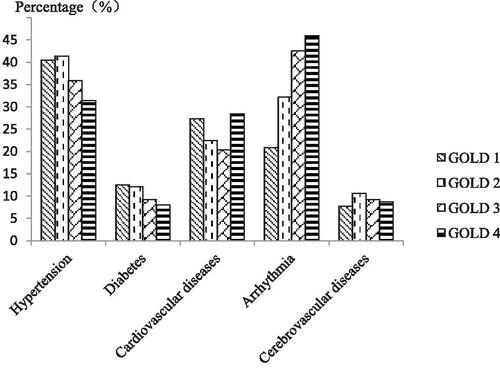
Table 3. Prevalence rates of five comorbidities in COPD patients according to the severity of airflow limitation.
Table 4. Results of logistic regression in analyzing the effect of OSA severity on comorbidities (Crude OR, 95% CI).
Table 5. Results of logistic regression in analyzing the effect of the severity of airflow limitation on comorbidities.
Table 6. Results of logistic regression used to explore risk factors for OSA in COPD patients.
Table 7. Results of logistic regression used to explore risk factors for hypertension.
Table 8. Results of logistic regression used to explore risk factors for arrhythmia.