
Figures & data
Table 1. Demographic and disease characteristics of patients in the claims sample.
Figure 1. Patient disposition flow chart.
Data from inpatient/ER (secondary care) charts, were requested only if the primary care chart had insufficient data.
Abbreviations: ER = emergency room.
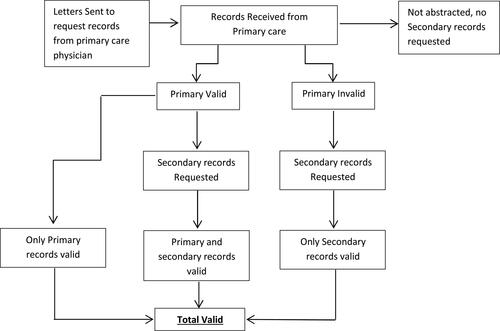
Table 2. Healthcare costs for the chart population predicted by the initial and final algorithms.
Table 3. Exacerbation costs for the final algorithm from the multivariate analysis two-part model, including predicted costs and bootstrapped 95% confidence intervals.
Data availability statement
The data contained in our database contains proprietary elements owned by Optum and, therefore, cannot be broadly disclosed or made publicly available at this time. The disclosure of these data to third-party clients assumes certain data security and privacy protocols are in place, and that the third-party client has executed our standard license agreement which includes restrictive covenants governing the use of the data.