
Figures & data
Figure 1. Patient Selection: CONSORT diagram.
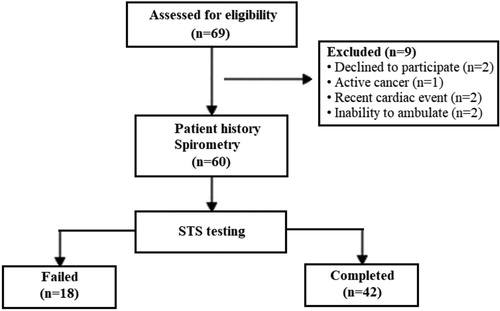
Table 1. Patients characteristics and comparison between groups of patients who completed or failed to complete the sit-to-stand tests (5STST and 30s-STST).
Table 2. Comparison of sit-to-stand (5STST and 30s-STST) measurements between patients with fewer and more symptoms and between patients with low and high risk of future exacerbations.
Figure 2. Correlation between COPD assessment test (CAT) and (A) the time to perform 5STST, and (B) the number of stands during 30s-STST.
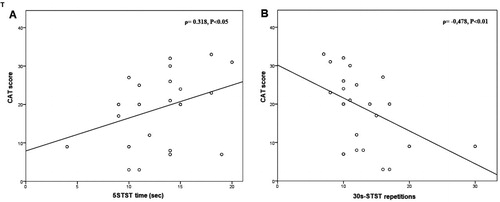
Table 3. Spearman rank correlation of sit-to-stand tests (5STST and 30s-STST) with various clinical and spirometric parameters.
Table 4. Results of multivariate linear regression analysis of the association of the time to complete the 5STST with multiple predictors.
Table 5. Results of multivariate linear regression analysis of the association of the repetitions of the sit-to-stand maneuver completed in the 30s-STST with multiple predictors.
Table 6. Spearman rank correlation of STST (5STST and 30s-STST) with CAT items.
Table 7. Results of multivariate linear regression analysis of the association of the time to complete the 5STST with different CAT items.
Table 8. Results of multivariate linear regression analysis of the association of the repetitions of the 30s-STST with different CAT items.