
Figures & data
Table 1. Process of factor analysis and cluster analysis to describe phenotypes in COPD.
Table 2. Characteristics of the COPD cohort.
Table 3. Percentage of the contribution of variables in clustering.
Figure 1. Percentage of the contribution of variables in clustering.
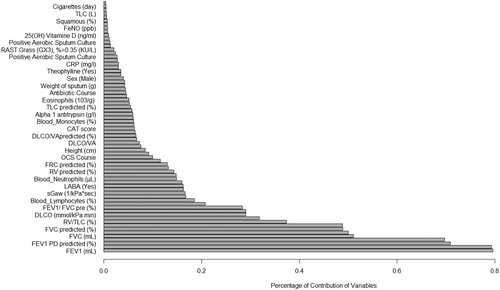
Figure 2. Lung function in three clusters.
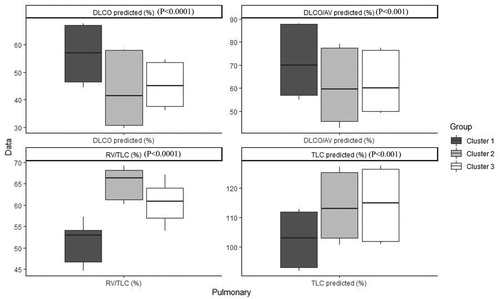
Figure 3. Blood in three clusters.
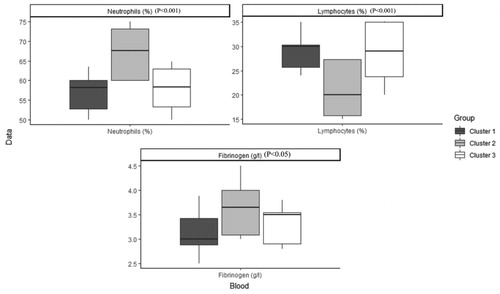
Figure 4. Sputum in three clusters.
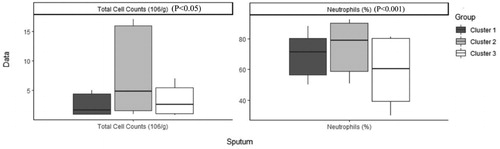
Figure 5. T2 biomarkers in three clusters.
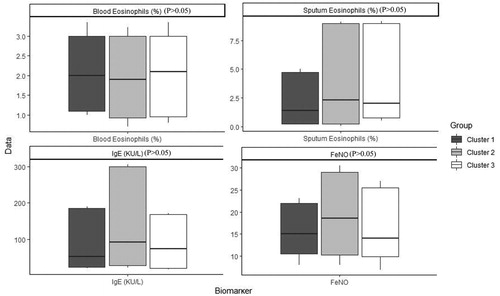
Figure 6. Cat Score in three clusters.
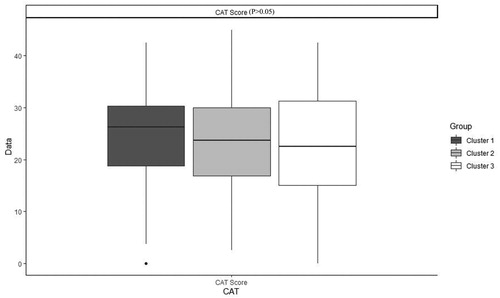
Table 4. Characteristics of patients with COPD after imputation, Median (IQR) / Percentage (frequency) in each cluster and comparison between clusters.
Table 5. Characteristics of patients with COPD before imputation, Median (IQR) / Percentage (frequency) in each cluster and comparison between clusters.