
Figures & data
Figure 1. Flow chart of the study design and the COPD patients who performed 6MWT at baseline and at follow-up 1 year later in the Bergen COPD Cohort Study.
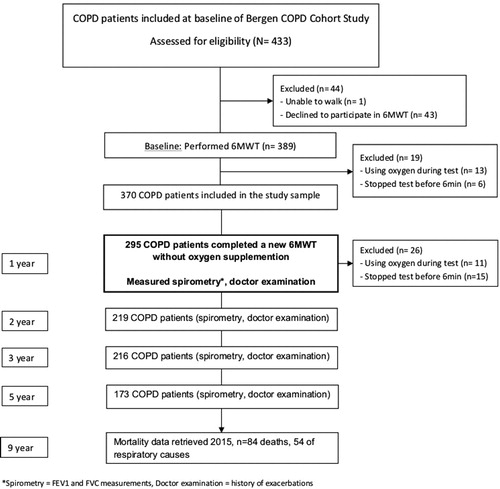
Figure 2. Timeline of the measurements of risk factors and outcomes.
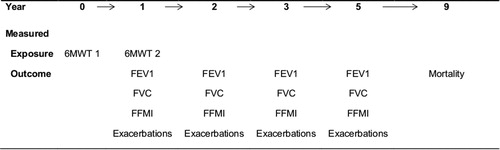
Table 1. Characteristics of 295 COPD patients in the Bergen COPD Cohort Study.
Figure 3. Associations of change in desaturation status in 6MWT in 1 year and all-cause and respiratory mortality after 9 years in 295 COPD patients, Kaplan-Meier for crude analyses and Cox proportional hazard regression for adjusted analyses (graph created using the posthoc stcurve syntax in Stata which plots mortality by desaturation category while setting each covariate to its mean values). (a) Unadjusted all-cause mortality. (b) After adjustment for sex, age, 6MWD, mMRC dyspnea scale, Charlson comorbidity index, smoking status, exacerbations 12 month prior inclusion and participation in pulmonary rehabilitation. (c) Unadjusted respiratory mortality. (d) After adjustments for sex, age, 6MWD, mMRC dyspnea scale, Charlson comorbidity index, smoking status and exacerbations 12 month prior inclusion and participation in pulmonary rehabilitation.
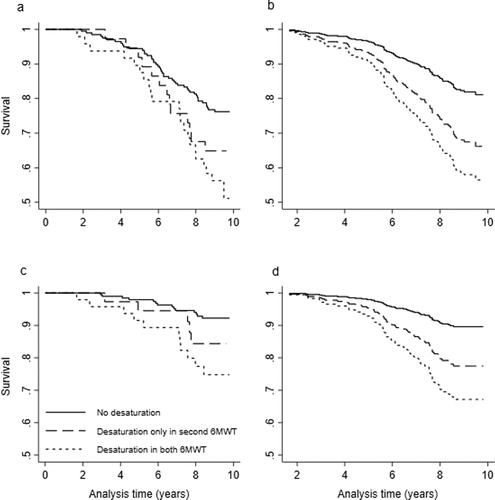
Table 2. Associations of 1 year change in walking distance and desaturation status in two 6MWTs with all-cause mortality and respiratory mortality after 9-year follow-up obtained from the Norwegian Cause of Death Registry, among 295 COPD patients in the Bergen COPD Cohort Study, using cox proportional hazard regression analyses.
Table 3. Associations of desaturation status in two 6MWTs with all-cause mortality and respiratory mortality after 9-year follow-up obtained from the Norwegian Cause of Death Registry, among 295 COPD patients in the Bergen COPD Cohort Study, using cox proportional hazard regression analyses, with additional adjustment for baseline values of FEV1% predicted and blood gas values.
Figure 4. Estimated decline in FVC % predicted with 95% CI from year 1 through 5 according to desaturation status in two 6MWTs in year 0 and 1 in 295 COPD patients, from linear mixed effects models.
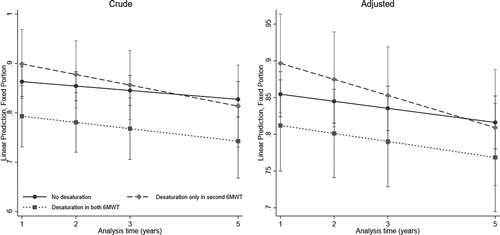
Table 4. One year change in desaturation status in two 6MWTs and association with decline in FVC % predicted over 5 years in 295 COPD patients from the Bergen COPD Cohort Study.[AQ3]
Table 5. One year change in walking distance in 6MWT and association with decline in FEV1% predicted over 5 years in 295 COPD patients from the Bergen COPD Cohort Study.