
Figures & data
Figure 1. Flow-chart describing the study population.
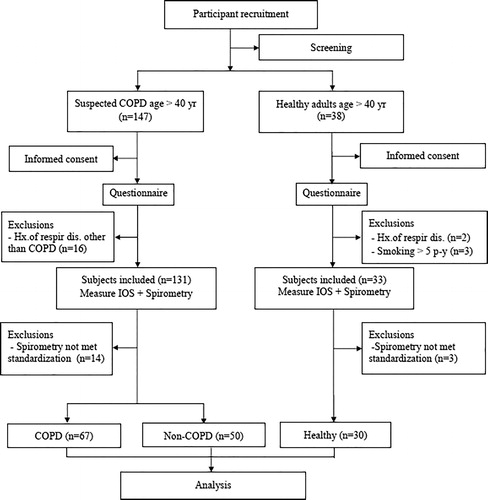
Table 1. Baseline characteristics of subjects. (N = 147).
Table 2. Spirometric data of subjects.
Table 3. IOS parameters of subjects.
Figure 2. Receiver operating characteristic curves illustrating the performance of IOS variables in diagnosis of COPD using the ratio of FEV1/FVC < LLN (A) and the ratio of FEV1/FVC < 0.7 (B) between COPD and chronic smokers.
Note: AuROC from score based ROC.
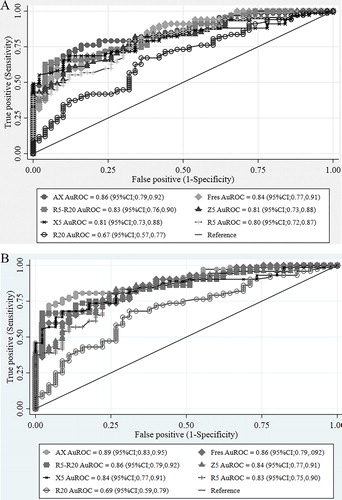
Figure 3. Receiver operating characteristic curves illustrating the performance of IOS variables in diagnosis of COPD using the ratio of FEV1/FVC < LLN (A) and the ratio of FEV1/FVC < 0.7 (B) between COPD and normal subjects.
Note: AuROC from score based ROC.
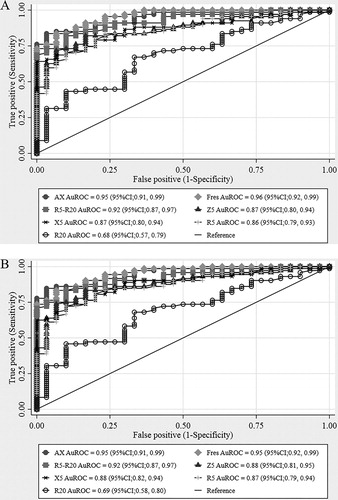
Table 4. Diagnostic performances of IOS parameters for diagnosis of COPD using the ratio of FEV1/FVC < LLN and the ratio of FEV1/FVC < 0.7 between COPD and chronic smokers.
Figure 4. Receiver operating characteristic curves illustrating the performance of IOS variables in diagnosis of COPD using the ratio of FEV1/FVC < LLN between COPD based on median %predicted of FEV1 (A; %predicted of FEV1 ≥ median value of group, B; % predicted of FEV1 < median value of group) and chronic smokers.
Note: AuROC from score based ROC.
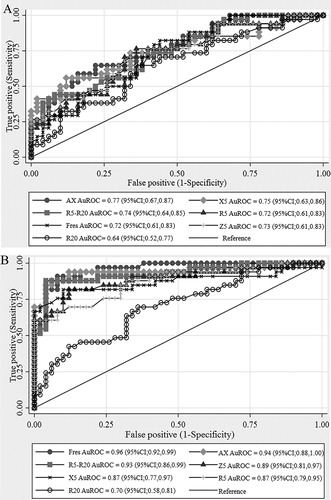
Table 5. Diagnostic performances of IOS parameters for diagnosis of COPD using the ratio of FEV1/FVC < LLN between COPD (based on the median FEV1) and chronic smokers.
Table 6. IOS parameters of subjects in our study compared to previous studies.