Figures & data
Figure 1. An example of a PA chest X-ray images of a patient who underwent bilateral EBCT procedure.
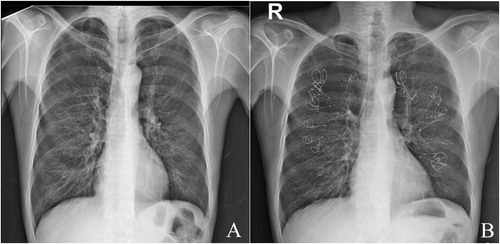
Figure 2. Flow diagram of study participants.
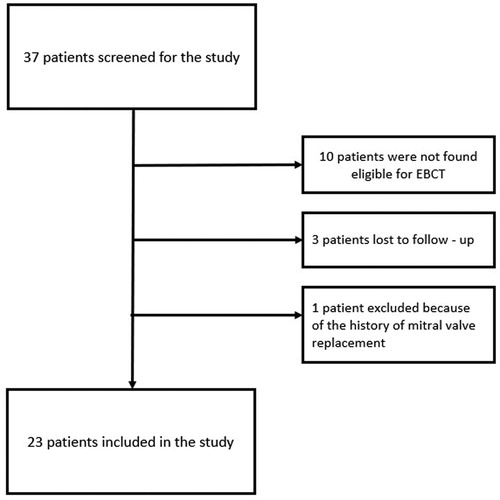
Table 1. Baseline characteristics of the study patients.
Table 2. Pre-EBCT and post-EBCT clinical and echocardiographic values. Data are presented as means ± standard deviations or median (minimum – maximum). Pre-EBCT and post-EBCT clinical and echocardiographic values. Data are presented as means ± standard deviations or median (minimum – maximum) according to distribution of normality.
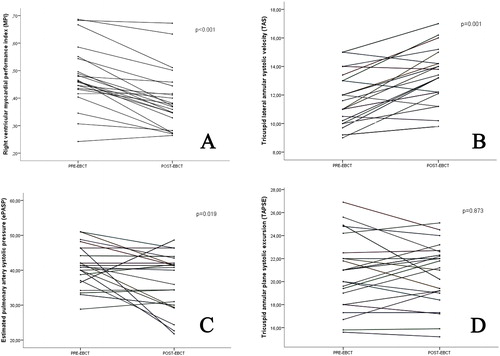
Figure 3. Post-procedural changes in echocardiographic parameters.