Figures & data
Figure 1. The flow of the subjects. Abbreviations: CAT, COPD assessment test; 6MWD, 6-minute walking distance.
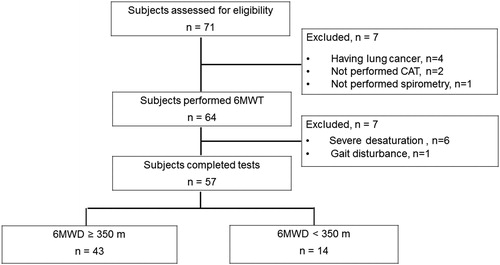
Figure 2. Colored 3 D images of Rrs and Xrs in each from an individual subject in each category. These images show the 30-second time course of Rrs and Xrs during tidal breathing. Oscillometric values, including R5 and X5, were output automatically by the computer.
Abbreviations: Rrs, respiratory system resistance; R5, Rrs at 5Hz; Xrs, respiratory system reactance; X5, Xrs at 5Hz; 6MWD, 6-minute walking distance.
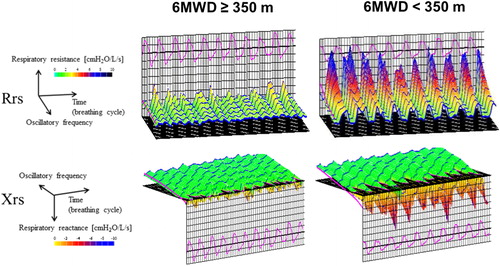
Table 1. Characteristics of the study subjects.
Table 2. Whole-breath and within-breath analyses of respiratory impedance.
Figure 3. Correlation between 6-minute walking distance and oscillometry. Abbreviations: ALX, low-frequency reactance area; Fres, resonant frequency; R5 and R20, respiratory system resistance at 5 Hz and 20 Hz; R5 − R20, the difference between R5 and R20; X5, respiratory system reactance at 5 Hz.
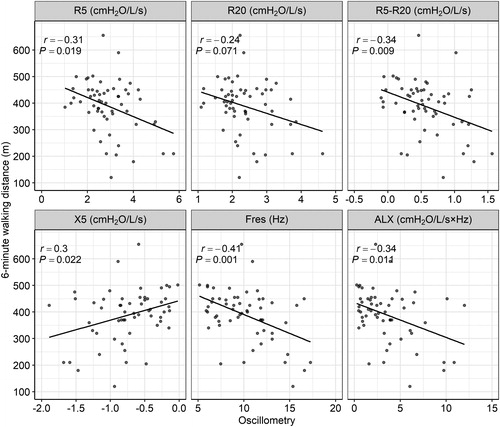
Table 3. Univariate and multivariate logistic regression analyses of 6MWD and predictor variables.
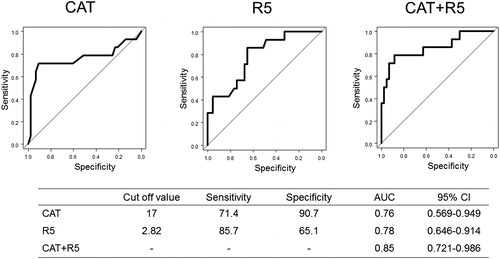
Figure 4. The ROC curve analysis predicting a 6-minute walking distance <350 m in the inspiratory phase.
Abbreviations: CAT, COPD assessment test; R5, respiratory system resistance at 5 Hz.