Figures & data
Figure 1. Patient flowcharts.
A. The KOCOSS Cohort was cross-sectionally analyzed. B. The Kyoto University Cohort was cross-sectionally and longitudinally analyzed.
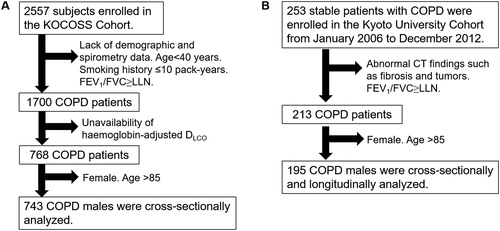
Table 1. Demographics of patients in the two cohorts.
Figure 2. Distributions of FEV1 and DLCO in the two cohorts.
A. KOCOSS Cohort. B. Kyoto University Cohort. Patients were categorized into four groups: (1) FEV1 z-score > –3 and DLCO z-score > –3 (reference, red), (2) FEV1 z-score > –3 and DLCO z-score ≤ –3 (disproportionally impaired DLCO, green), (3) FEV1 z-score ≤ –3 and DLCO z-score > –3 (disproportionally impaired FEV1, blue), and (4) FEV1 z-score ≤ –3 and DLCO z-score ≤ –3 (mixed-impaired, purple).
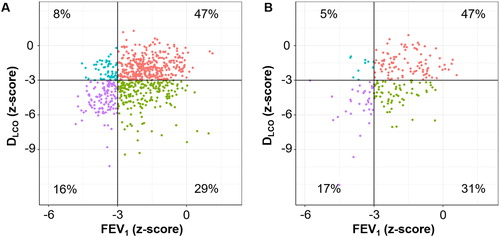
Figure 3. Associations of DLCO, FEV1, and both impairments with patient-reported outcomes and exercise capacity in a multivariable analysis of the KOCOSS cohort.
Patients (n = 743) were categorized into four groups: (1) FEV1 z-score > –3 and DLCO z-score > –3 (reference, n = 351), (2) FEV1 z-score > –3 and DLCO z-score ≤ –3 (disproportionally impaired DLCO, n = 212), (3) FEV1 z-score ≤ –3 and DLCO z-score > –3 (disproportionally impaired FEV1, n = 62), and (4) FEV1 z-score ≤ –3 and DLCO z-score ≤ –3 (mixed-impaired, n = 118). A dot with an error bar indicates the least-square mean (LS mean) with the 95% CI. * p<.05 compared to the reference group in the multivariable models. Each model was adjusted for age, pack-years of smoking, height and weight. 6MWD = six-minute walking distance. CAT = COPD assessment test. SGRQ = St. George's Respiratory Questionnaire. 6MWD, CAT, and SGRQ data were available for 641, 717, and 395 patients, respectively.
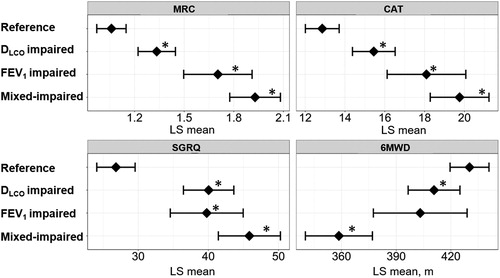
Table 2. Clinical characteristics of the four groups in the KOCOSS Cohort.
Figure 4. Associations of DLCO, FEV1, and both impairments with emphysema subtypes and arterial blood gases in a multivariable analysis of the Kyoto University Cohort.
Patients (n = 195) were categorized into four groups: (1) FEV1 z-score > –3 and DLCO z-score > –3 (reference, n = 89), (2) FEV1 z-score > –3 and DLCO z-score ≤ –3 (disproportionally impaired DLCO, n = 62), (3) FEV1 z-score ≤ –3 and DLCO z-score > –3 (disproportionally impaired FEV1, n = 10), and (4) FEV1 z-score ≤ –3 and DLCO z-score ≤ –3 (mixed-impaired, n = 34). (A) Odds ratio for the presence of paraseptal emphysema and centrilobular emphysema on CT. A dot with an error bar indicates the regression coefficient with the 95% CI. (B) Least-square mean (LS mean) with the 95% CI for the partial pressure of oxygen (PaO2) and partial pressure of carbon dioxide (PaCO2). * p<.05 compared to the reference group in the multivariable models. Each model was adjusted for age, pack-years of smoking, height and weight. PaO2 and PaCO2 data were available for 184 patients.
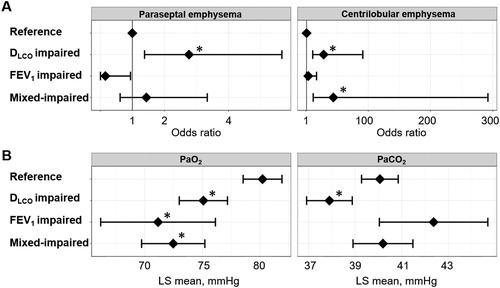
Table 3. Clinical characteristics of the four groups in the Kyoto University Cohort.
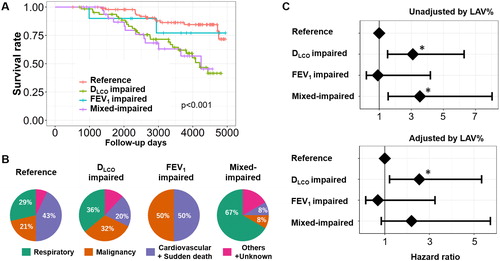
Figure 5. Long-term survival of patients with COPD in the Kyoto University Cohort.
(A) Kaplan–Meier curves of survival for the four groups: (1) FEV1 z-score > –3 and DLCO z-score > –3 (reference, n = 89), (2) FEV1 z-score > –3 and DLCO z-score ≤ –3 (disproportionally impaired DLCO, n = 62), (3) FEV1 z-score ≤ –3 and DLCO z-score > –3 (disproportionally impaired FEV1, n = 10), and (4) FEV1 z-score ≤ –3 and DLCO z-score ≤ –3 (mixed-impaired, n = 34). (B) Causes of death. (C) Multivariable Cox proportional hazard models. A dot with an error bar indicates the hazard ratio with 95% CI. * p<.05 compared to the reference group in the multivariable models. The model used for the upper panel included the group, age, pack-years of smoking, height, and weight as independent variables, and the model used for the lower panel included the group, age, pack-years of smoking, height, weight, and LAV% (a CT index of emphysema severity) as independent variables.