Figures & data
Table 1. Demographics and resting pulmonary function of study population.
Figure 1. V˙̇E/V˙CO2, PCO2, VD/VT during a ramp incremental exercise test using 4 different methods of PCO2 assessment in a representative COPD patient. Ventilatory equivalents (left panel), PCO2 (middle panel) and VD/VT (right panel). The four different expressions of PCO2 and VD/VT are shown. Closed circles: PaCO2, arterial partial pressure of carbon dioxide from blood gas; VD/VTABG, VD/VT calculated using PaCO2. Open circles: V˙E/V˙O2, ventilatory equivalent for oxygen; TcPCO2, transcutaneous partial pressure of carbon dioxide; VD/VTTc, VD/VT calculated using TcPCO2. Closed triangles: V˙E/V˙CO2, ventilatory equivalent for carbon dioxide; PaCO2-Jones, estimated partial pressure of carbon dioxide using the Jones equation [Citation7]; VD/VT-Jones, VD/VT calculated usingPaCO2-Jones. Open triangles: PETCO2, end-tidal partial pressure of carbon dioxide; VD/VTETCO2, VD/VT calculated using PETCO2. The representative subject with FEV1=40%predicted and FEV1/FVC = 33% (GOLD 3 COPD). Vertical lines showed the change in exercise phase (from left to right): start of unloaded cycling; start of incremental exercise; lactate threshold and start of recovery.
![Figure 1. V˙̇E/V˙CO2, PCO2, VD/VT during a ramp incremental exercise test using 4 different methods of PCO2 assessment in a representative COPD patient. Ventilatory equivalents (left panel), PCO2 (middle panel) and VD/VT (right panel). The four different expressions of PCO2 and VD/VT are shown. Closed circles: PaCO2, arterial partial pressure of carbon dioxide from blood gas; VD/VTABG, VD/VT calculated using PaCO2. Open circles: V˙E/V˙O2, ventilatory equivalent for oxygen; TcPCO2, transcutaneous partial pressure of carbon dioxide; VD/VTTc, VD/VT calculated using TcPCO2. Closed triangles: V˙E/V˙CO2, ventilatory equivalent for carbon dioxide; PaCO2-Jones, estimated partial pressure of carbon dioxide using the Jones equation [Citation7]; VD/VT-Jones, VD/VT calculated usingPaCO2-Jones. Open triangles: PETCO2, end-tidal partial pressure of carbon dioxide; VD/VTETCO2, VD/VT calculated using PETCO2. The representative subject with FEV1=40%predicted and FEV1/FVC = 33% (GOLD 3 COPD). Vertical lines showed the change in exercise phase (from left to right): start of unloaded cycling; start of incremental exercise; lactate threshold and start of recovery.](/cms/asset/2cc62c6b-22fd-4dcc-864a-f757ae9abcbb/icop_a_1858403_f0001_c.jpg)
Figure 2. Mean (±SE) V˙E/V˙CO2, PCO2, VD/VT during a ramp incremental exercise test using 4 different methods of PCO2 assessment in 10 COPD patients. Ventilatory equivalents (left panel), PCO2 (middle panel) and VD/VT (right panel).UL, Unloaded cycling. LT, lactate threshold. The four different expressions of PCO2 and VD/VT are shown. Closed circles: PaCO2, arterial partial pressure of carbon dioxide from blood gas; VD/VTABG, VD/VT calculated using PaCO2. Open circles: TcPCO2, transcutaneous partial pressure of carbon dioxide; VD/VTTc, VD/VT calculated using TcPCO2. Closed triangles: PaCO2-Jones, estimated partial pressure of carbon dioxide using the Jones equation [Citation7]; VD/VT-Jones, VD/VT calculated using PaCO2-Jones. Open triangles: PETCO2, end-tidal partial pressure of carbon dioxide; VD/VTETCO2, VD/VT calculated using PETCO2. *p < 0.05, **p < 0.01, ***p < 0.001 vs. PaCO2 or VD/VTABG. #p < 0.05, ##p < 0.01, ###p < 0.001 vs. LT (for PCO2) or peak (for VD/VT).
![Figure 2. Mean (±SE) V˙E/V˙CO2, PCO2, VD/VT during a ramp incremental exercise test using 4 different methods of PCO2 assessment in 10 COPD patients. Ventilatory equivalents (left panel), PCO2 (middle panel) and VD/VT (right panel).UL, Unloaded cycling. LT, lactate threshold. The four different expressions of PCO2 and VD/VT are shown. Closed circles: PaCO2, arterial partial pressure of carbon dioxide from blood gas; VD/VTABG, VD/VT calculated using PaCO2. Open circles: TcPCO2, transcutaneous partial pressure of carbon dioxide; VD/VTTc, VD/VT calculated using TcPCO2. Closed triangles: PaCO2-Jones, estimated partial pressure of carbon dioxide using the Jones equation [Citation7]; VD/VT-Jones, VD/VT calculated using PaCO2-Jones. Open triangles: PETCO2, end-tidal partial pressure of carbon dioxide; VD/VTETCO2, VD/VT calculated using PETCO2. *p < 0.05, **p < 0.01, ***p < 0.001 vs. PaCO2 or VD/VTABG. #p < 0.05, ##p < 0.01, ###p < 0.001 vs. LT (for PCO2) or peak (for VD/VT).](/cms/asset/f6907b4b-4be3-42a4-9e22-6f76124ee841/icop_a_1858403_f0002_c.jpg)
Table 2. Ventilatory, gas exchange and blood gases at rest and during incremental exercise in COPD patients.
Figure 3. Regression and Bland-Altman analysis of PCO2 and VD/VT using ABG and transcutaneous measurements during rest and incremental exercise in 10 COPD patients. A. Scatter plot and linear regression of TcPCO2 vs. PaCO2. B. Bland-Altman plot of agreement between TcPCO2 and PaCO2. C. Scatter plot and linear regression of VD/VTTc vs. VD/VTABG. D. Bland-Altman plot of agreement between VD/VTTc and VD/VTABG.
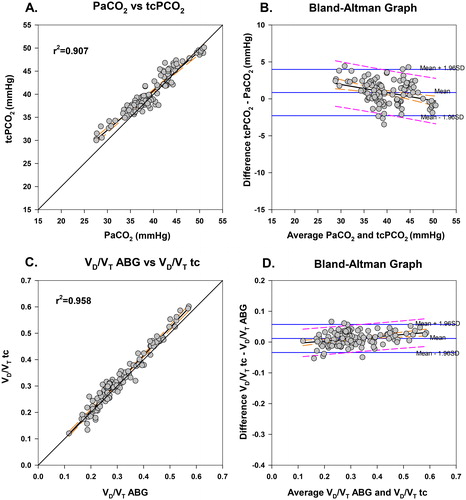
Table 3. Lin's Concordance Correlation Coefficients (CCC) and Bland–Altman analyses among the four different expressions of PaCO2 and VD/VT during rest and incremental exercise in COPD patients.
Figure 4. Regression and Bland-Altman analysis of PCO2 and VD/VT using ABG and Jones equation during rest and incremental exercise in 10 COPD patients. A. Scatter plot and linear regression of PaCO2-Jones vs. PaCO2. B. Bland-Altman plot of agreement between PaCO2-Jones and PaCO2. C. Scatter plot and linear regression of agreement between VD/VT-Jones and VD/VTABG. D. Bland-Altman plot of agreement between VD/VT-Jones and VD/VTABG.
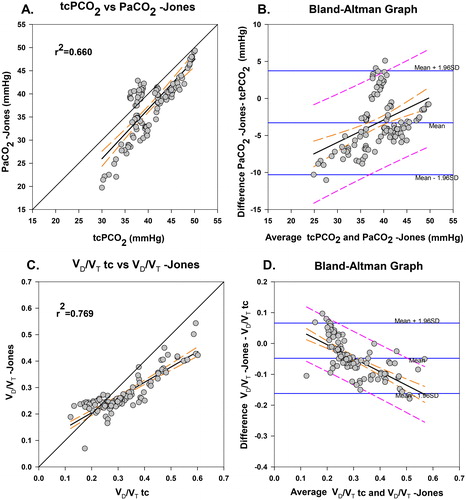
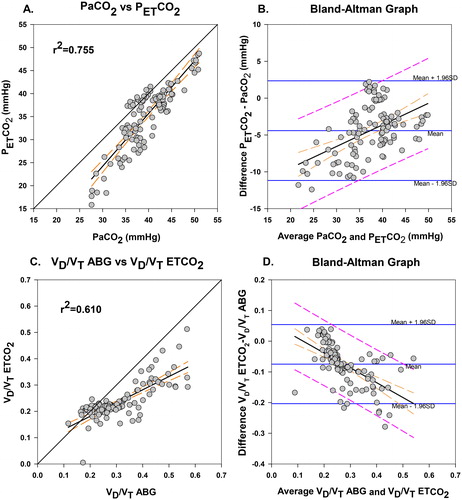
Figure 5. Regression and Bland-Altman analysis of PCO2 and VD/VT using ABG and end -tidal CO2 during rest and incremental exercise in 10 COPD patients. A. Scatter plot and linear regression of PETCO2 vs. PaCO2. B. Bland-Altman plot of agreement between PETCO2 and PaCO2. C. Scatter plot and linear regression of VD/VTETCO2 vs. VD/VTABG. D. Bland-Altman plot of agreement between VD/VTETCO2 and VD/VTABG.