
Figures & data
Table 1. Baseline characteristics of the total sample and comparison between groups that achieved and failed to achieve the MID of TGlittre, LCADL and ADLs (TGlittre and LCADL) after the pulmonary rehabilitation program.
Figure 1. (A) Correlation between Glittre-ADL test (TGlittre) pre-exercise training program (ETP) and change in TGlittre (post-ETP—pre-ETP); (B) correlation between London Chest Activity of Daily Living scale (LCADL) pre-ETP and change in LCADL (post-ETP—pre-ETP).
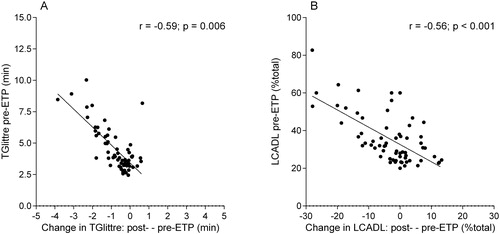
Figure 2. Receiver operating characteristic curve for the: (a) Glittre-ADL test (TGlittre) in minutes cut-off point to identify the subjects with COPD who achieved the minimal important difference (MID) of TGlittre, sensitivity= 76%, specificity= 73%, area under the ROC curve (AUC)= 0.77 (95%CI: 0.65 to 0.89), p < 0.001; (B) TGlittre in percentage of predicted cut-off point to identify the subjects with COPD who achieved the MID of TGlittre, sensitivity= 62%, specificity= 70%, AUC= 0.67 (95%CI: 0.54 to 0.80), p = 0.010; (C) London Chest Activity of Daily Living scale (LCADL) cut-off point to identify the subjects with COPD who achieved the MID of LCADL, sensitivity= 85%, specificity= 70%, AUC= 0.81 (95%CI: 0.71 to 0.92), p < 0.001; [D] LCADL cut-off point to identify the subjects with COPD who achieved the MID of Activities of Daily Living (ADLs – MID of TGlittre and LCADL), sensitivity= 93%, specificity= 60%, AUC= 0.78 (95%CI: 0.66 to 0.90), p < 0.001.
![Figure 2. Receiver operating characteristic curve for the: (a) Glittre-ADL test (TGlittre) in minutes cut-off point to identify the subjects with COPD who achieved the minimal important difference (MID) of TGlittre, sensitivity= 76%, specificity= 73%, area under the ROC curve (AUC)= 0.77 (95%CI: 0.65 to 0.89), p < 0.001; (B) TGlittre in percentage of predicted cut-off point to identify the subjects with COPD who achieved the MID of TGlittre, sensitivity= 62%, specificity= 70%, AUC= 0.67 (95%CI: 0.54 to 0.80), p = 0.010; (C) London Chest Activity of Daily Living scale (LCADL) cut-off point to identify the subjects with COPD who achieved the MID of LCADL, sensitivity= 85%, specificity= 70%, AUC= 0.81 (95%CI: 0.71 to 0.92), p < 0.001; [D] LCADL cut-off point to identify the subjects with COPD who achieved the MID of Activities of Daily Living (ADLs – MID of TGlittre and LCADL), sensitivity= 93%, specificity= 60%, AUC= 0.78 (95%CI: 0.66 to 0.90), p < 0.001.](/cms/asset/6bbe9e79-fa43-4dc7-b8a7-55711e6e81ab/icop_a_1868421_f0002_b.jpg)
Figure 3. Comparison of pre- (open circles) and post- (closed circles) exercise training program: (A) Glittre-ADL test (TGlittre) in minutes of total sample, subjects who achieved the minimal important difference (AMID) and who failed to achieve the minimal important difference (NAMID) of TGlittre; (B) London Chest Activity of Daily Living scale (LCADL) in %total of total sample, subjects who achieved the minimal important difference (AMID) and who failed to achieve the minimal important difference (NAMID) of LCADL; and (C) LCADL of total sample, subjects who achieved the minimal important difference (AMID) and who failed to achieve the minimal important difference (NAMID) of LCADL. The horizontal line highlights the cut-off point of TGlittre and LCADL.
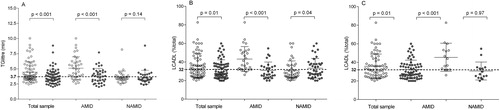
Table 2. Binary logistic regression: predicting factors of achieving of MID of TGlittre and MID of LCADL.