Figures & data
Table 1. Anchor and distribution-based methods to estimate the minimal important and detectable differences.
Figure 1. Flow diagram of people with chronic obstructive pulmonary disease included in the study. Legend: 1RM, 1 repetition maximum; COPD, chronic obstructive pulmonary disease; HHD, hand-held dynamometry; PR, pulmonary rehabilitation.
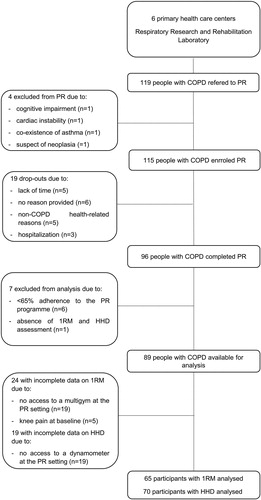
Table 2. Sample characterisation.
Table 3. Outcome measures before and after the 12-week community-based pulmonary rehabilitation programme in people with COPD.
Figure 2. - Linear regression of A) changes in one-repetition maximum (1RM) of quadriceps muscle strength and changes in the six-minute walk test (6MWT) and B) percentage of changes in 1RM of quadriceps muscle strength and changes in the 6MWT.
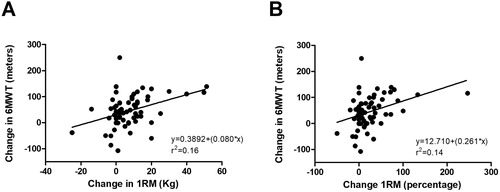
Figure 3. - Plot of the pooled MCID for one-repetition maximum (1RM) of quadriceps muscle strength. The plot represents the MCID estimates derived in this study, and where appropriate the estimates include the 95% confidence interval (n = 65). Abbreviations: 6MWD, distance performed on six-minute walk test; SD, standard deviation; SEM, standard error measurement; MDC, minimal detectable change.
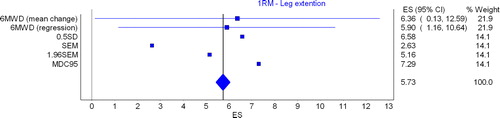
Table 4. Anchor and distribution-based methods used to compute the minimal clinically important difference of quadriceps muscle strength.
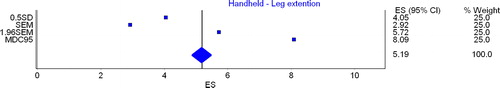
Figure 4. - Plot of the pooled MCID for quadriceps muscle strength assessed with hand-held dynamometer. The plot represents the MCID estimates derived in this study, and where appropriate the estimates include the 95% confidence interval (n = 70). Abbreviations: SD, standard deviation; SEM, standard error measurement; MDC, minimal detectable change.