Figures & data
Figure 1. Consort diagram of the study.
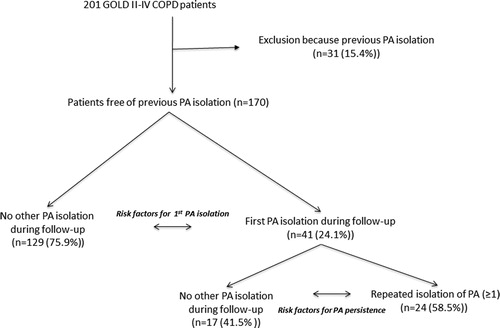
Figure 2. Association network for first PA isolation (Panel A) and PA persistence (Panel B). For network description and further information, see text.
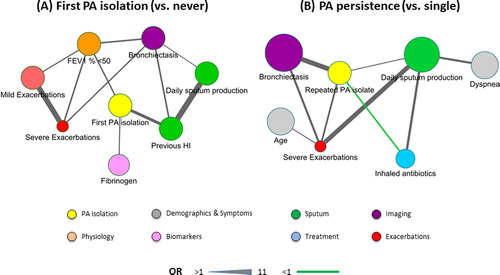
Table 1. Baseline and follow-up characteristics of patients with a first isolation of PA vs. those without any during follow-up.
Table 2. Factors associated with first isolation of PA identified by the Cox multivariate analysis, ordered by Hazard Ratio (HR) values.
Table 3. Baseline and follow-up characteristics of patients with single PA isolate vs. PA persistence (≥2 isolations).
Table 4. Factors associated with persistence of PA identified by the Cox multivariate analysis, ordered by Hazard Ratio (HR) values.
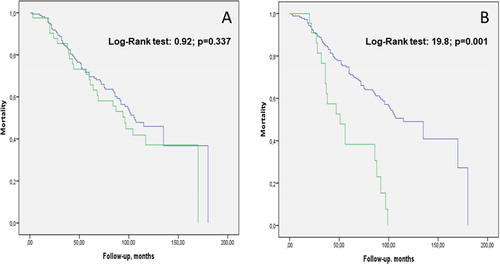
Figure 3. All-cause mortality Kaplan Meier curves. Panel A: Patients with single PA isolation (green line) vs. no PA isolation (blue line). Panel B. Patients with PA persistence during follow-up (green line) vs. no PA isolation (blue line). For further explanations, see text.