
Figures & data
Figure 1. Flow chart of patient selection.
BE: bronchiectasis; COPD: chronic obstructive pulmonary disease.
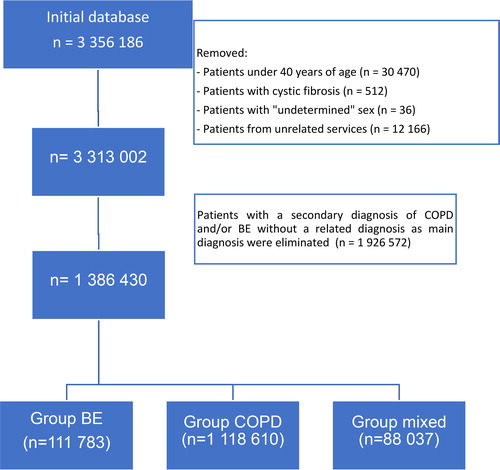
Table 1. General characteristics of patients and hospitalizations.
Figure 2. Temporal evolution of hospitalizations in each group, by sex and age ranges.
BE: bronchiectasis; COPD: chronic obstructive pulmonary disease.
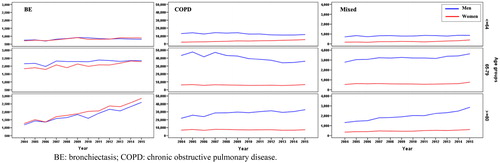
Table 2. Temporal evolution of discharges between 2004 and 2015. Total number of hospitalizations each year, annual rate of admissions per 100,000 inhabitants, and percentage of interannual variation of the rate of hospitalizations for each group are indicated.
Figure 3. Evolution of the mean length of stay by groups.
BE: bronchiectasis; COPD: chronic obstructive pulmonary disease.
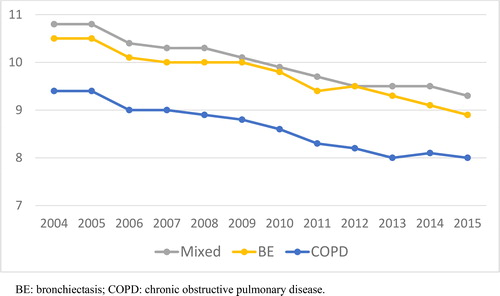
Table 3. Bivariate and multivariate logistic regression analysis for mortality.
Figure 4. Annual mortality rate between 2004 and 2015.
BE: bronchiectasis; COPD: chronic obstructive pulmonary disease.
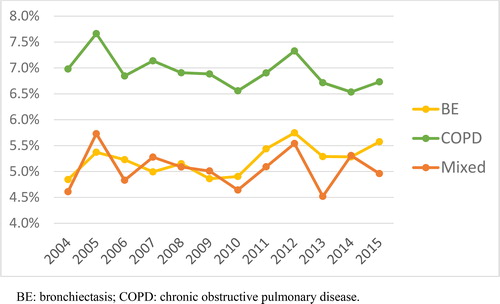
Table 4. Bivariate and multivariate analysis for hospital length of stay. Poisson model.
Table 5. Cost of hospitalizations: Global annual cost of admissions in each group and interannual cost variation.