
Figures & data
Figure 1. HCRU study periods. HCRU: health care resource utilization.
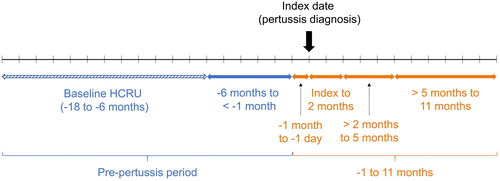
Table 1. Baseline demographic and clinical characteristics for the post-matched cohort.
Figure 2. Incidence of pertussis among patients with COPD: overall, by calendar year, and by age group. CI: confidence interval; COPD: chronic obstructive pulmonary disease; CPRD: Clinical Practice Research Datalink; NC: not calculable (*due to low cell counts of 1–4, blinded as per CPRD policy); PYFU: person-years of follow-up.
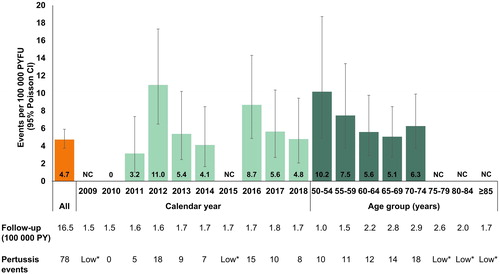
Figure 3. Mean HCRU among patients with COPD from: a -1 month to the day before the index date (pertussis diagnosis) and b the index date to 2 months.
aRates and 95% CIs were obtained by negative binomial models, except for A&E visits for the non-pertussis cohort between -1 month and -1 day, which were obtained assuming a Poisson distribution as the negative binomial model did not converge. p values from unadjusted Wilcoxon rank sum test.
A&E: accident and emergency; CI: confidence interval; COPD: chronic obstructive pulmonary disease; GP: general practitioner; HCRU: health care resource utilization; PY: person years.
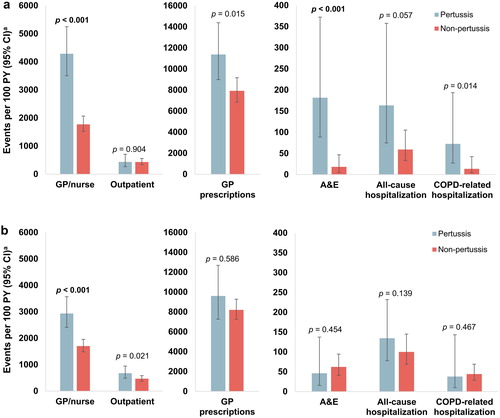
Table 2. HCRU rates per 100 patient-years during several periods from -6 months to +11 months around the index date.
Table 3. Number of patients (%) with ≥ 1 of each type of HCRU during several periods from −6 months to +11 months around the index date.
Figure 4. Monthly mean HCRUa among patients with COPD and pertussis or COPD alone from 18 months before to 11 months after the index date (pertussis diagnosis) for the following resource utilizations: a GP or nurse visits; b outpatient visits; c GP prescriptions; d A&E visits; e all-cause hospitalizations; and f COPD-related hospitalizations.
aMonths are labeled according to the start time of each interval, e.g., utilization reported at Month 0 is the average from index day (Day 0) to Day 30.
A&E: accident and emergency; COPD: chronic obstructive pulmonary disease: GP: general practitioner; HCRU: health care resource utilization.
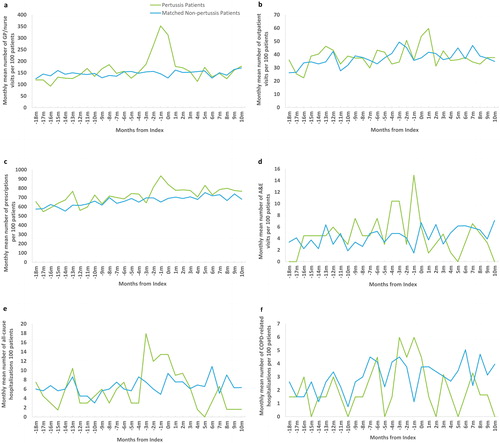
Figure 5. Annualized per-patient DMCa during the various time periods of the study.
aValues above bars show total mean ± 95% CI annualized DMC per patient including the most common five prescriptions and the most common five clinical assessments (which were added to the cost assessment in order to give a more precise estimate of the total DMC). 95% CI were obtained assuming Student’s t distribution for the annualized DMC means. GP, nurse, and outpatient specialist costs were derived from the 2019 Unit Costs of Health and Social Care published by the Personal Social Services Research Unit [Citation31]. Unit costs for the five most commonly prescribed products were derived from the September 2019 NHS Drug Tariff [Citation32]. The unit costs for the five most common clinical assessments and A&E costs were extracted from the 2018/2019 National Schedule of NHS Reference Costs [Citation33]. Inpatient hospitalization costs were derived using reference costs from the 2018/2019 National Schedule of Reference Costs [Citation36].
A&E: accident and emergency; DMC: direct medical costs; CI: confidence interval; GP: general practitioner; NHS: National Health Service.
![Figure 5. Annualized per-patient DMCa during the various time periods of the study.aValues above bars show total mean ± 95% CI annualized DMC per patient including the most common five prescriptions and the most common five clinical assessments (which were added to the cost assessment in order to give a more precise estimate of the total DMC). 95% CI were obtained assuming Student’s t distribution for the annualized DMC means. GP, nurse, and outpatient specialist costs were derived from the 2019 Unit Costs of Health and Social Care published by the Personal Social Services Research Unit [Citation31]. Unit costs for the five most commonly prescribed products were derived from the September 2019 NHS Drug Tariff [Citation32]. The unit costs for the five most common clinical assessments and A&E costs were extracted from the 2018/2019 National Schedule of NHS Reference Costs [Citation33]. Inpatient hospitalization costs were derived using reference costs from the 2018/2019 National Schedule of Reference Costs [Citation36].A&E: accident and emergency; DMC: direct medical costs; CI: confidence interval; GP: general practitioner; NHS: National Health Service.](/cms/asset/5c11445b-bb35-4d70-b09f-21194306093b/icop_a_1899155_f0005_c.jpg)
Supplemental Material
Download PDF (560.3 KB)Data availability
The datasets generated and/or analyzed during the current study are not publicly available as CPRD data are accessed via a license, the terms of which do not allow for the sharing of raw data.
Disclaimer This study is based in part on data from the Clinical Practice Research Datalink obtained under license from the UK Medicines and Healthcare products Regulatory Agency. However, the interpretation and conclusions contained in this report are those of the authors alone.