Figures & data
Figure 1. Flow diagram of study selection process.
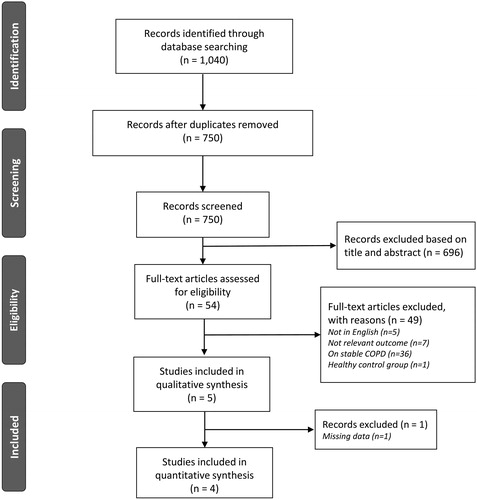
Table 1. Studies included in this systematic review.
Figure 2. Forest plots of the difference in (A) FMD%, (B) RHI (PAT), among patients during AECOPD and patients at recovery/stable condition. AECOPD, acute exacerbation of chronic obstructive pulmonary disease; FMD, flow-mediated dilatation; RHI, reactive hyperemia index; PAT, peripheral arterial tonometry.
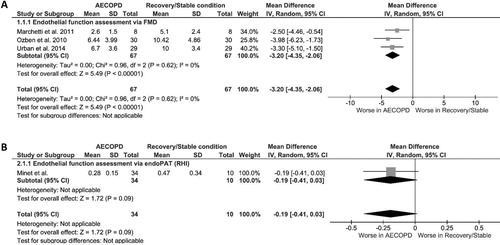
Figure 3. Forest plot of the difference in NMD% among patients during AECOPD and patients at recovery/stable condition. AECOPD, acute exacerbation of chronic obstructive pulmonary disease; NMD, nitroglycerine-mediated dilatation.
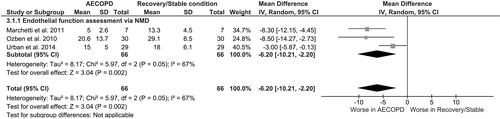
Figure 4. Forest plot of the difference in endothelial function among patients during AECOPD and patients at recovery/stable condition (all methods). AECOPD, acute exacerbation of chronic obstructive pulmonary disease.
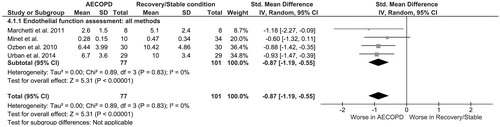
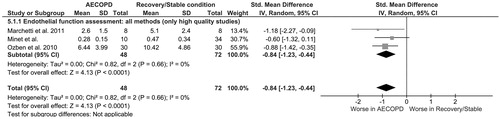
Figure 5. Sensitivity analysis (included studies with NOS score ≥7): Forest plot of the difference in endothelial function among patients during AECOPD and patients at recovery/stable condition (all methods). AECOPD, acute exacerbation of chronic obstructive pulmonary disease; NOS, Newcastle-Ottawa-Scale.