
Figures & data
Figure 1. Design of the study.
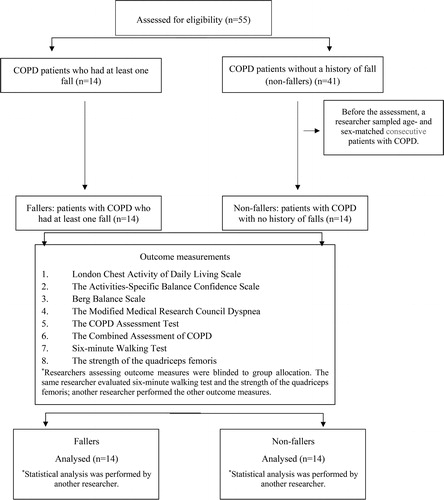
Table 1. Demographic and clinical characteristics of groups.
Table 2. Comparison of the LCADL scale item scores between groups.
Table 3. Comparison of the ABC scale item scores between groups.
Table 4. Partial correlation between the LCADL scale item scores, LCADL total score and the ABC scale score and BBS score.