
Figures & data
Table 1. Sputum-guided treatment algorithm.
Table 2. Anti-inflammatory hierarchy.
Table 3. Baseline characteristics of patient cohort.
Figure 1. Clinic and sputum feasibility. Includes the number of patients referred to and attending the COPD post-discharge clinic, as well as the number able to provide a sputum sample adequate for analysis and the number of patients with abnormal sputum.
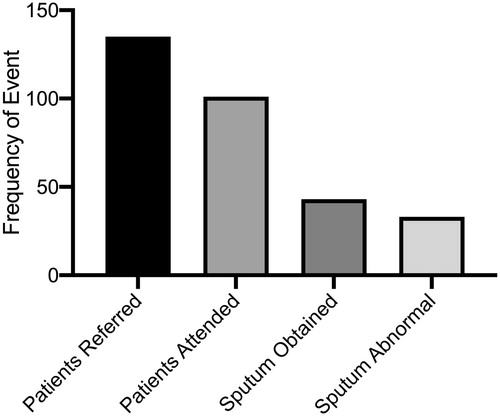
Figure 2. Prevalence of specific types of airway inflammation as measured in sputum.
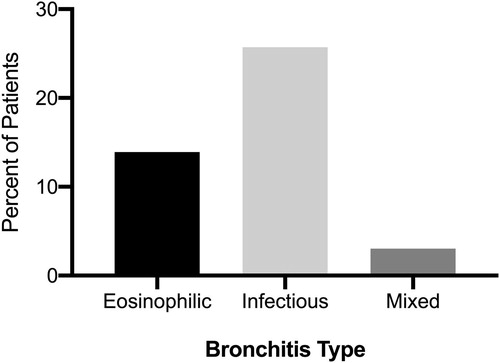
Table 4. Summary of healthcare utilization in the 6-months prior to and after Clinic Visit 1.