Figures & data
Figure 1. Study flow diagram. AECOPD, acute exacerbation of chronic obstructive pulmonary disease; CAP, community-acquired pneumonia.
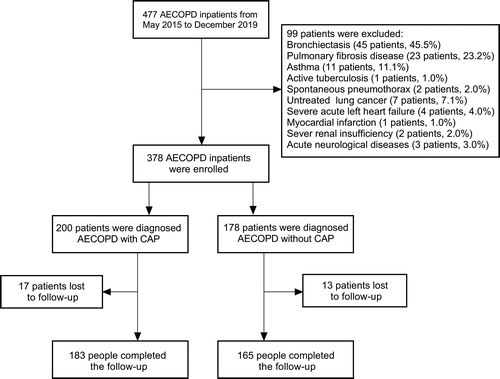
Table 1. General characteristics of AECOPD patients with and without CAP.
Table 2. Clinical characteristics, laboratory findings and outcomes of AECOPD patients with and without CAP.
Figure 2. Predictors for the early discrimination between AECOPD with CAP and AECOPD without CAP. The filled rectangles and solid lines represent OR values and 95% CIs. Hosmer-Lemeshow goodness-of-fit test: χ2, 4.545; P, 0.715. ICS, inhaled corticosteroid; CRP, C-reactive protein; PCT, procalcitonin.
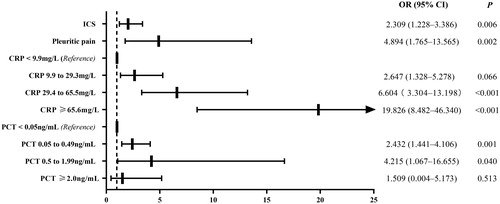
Figure 3. Kaplan–Meier analysis was used for cumulative survival, readmission and CAP readmission rates. (A) The cumulative survival rate was lower in the AECOPD with CAP group than in the AECOPD without CAP group (13.0% vs. 3.37%; HR: 4.099; 95% CI, 2.049–8.199; p < 0.001). (B) The readmission rate was similar between the AECOPD with CAP group and the AECOPD without CAP group (41.0% vs. 44.4%; HR: 1.051; 95% CI, 0.773–1.430; p = 0.530). (C) The patients with first-time exacerbation due to CAP were more likely to experience successive pneumonic exacerbation (58.5% vs. 31.3%; HR: 2.621; 95% CI, 1.647–4.170; p < 0.001).
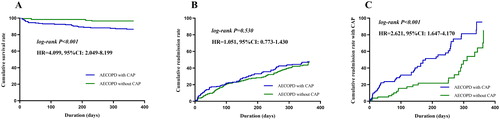
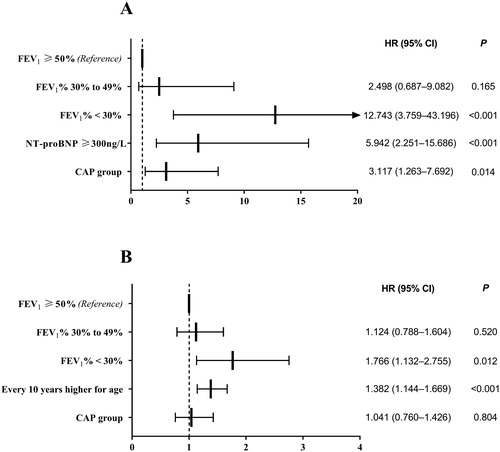
Figure 4. Cox model was used to determine the risk factors influencing death and readmission. (A) The AECOPD with CAP group (HR: 3.117; 95% CI: 1.263–7.692; p = 0.014), FEV1% < 30% (HR: 12.743; 95% CI: 3.759–43.196; p < 0.001) and NT-proBNP ≥ 300 ng/L (HR: 5.942; 95% CI: 2.251–15.686; p < 0.001) were associated with death. (B) The FEV1% < 30% (HR: 1.766; 95% CI: 1.132–2.755; p = 0.012) and every 10 years higher for age (HR: 1.382; 95% CI: 1.144–1.669; p < 0.001) were risk factors for readmission. FEV1, forced expiratory volume in 1 s; NT-proBNP, N terminal pro B-type natriuretic peptide.