
Figures & data
Figure 1. Flowchart of study.
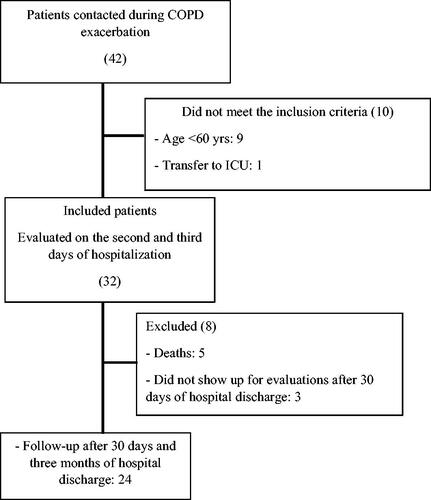
Table 1. Sample characterization data.
Figure 2. Predicted muscle strength values (%) and number of steps dichotomized according to the cutoff values, below and above of 80% e 4580 steps respectively, illustrated in the three moments of evaluation.
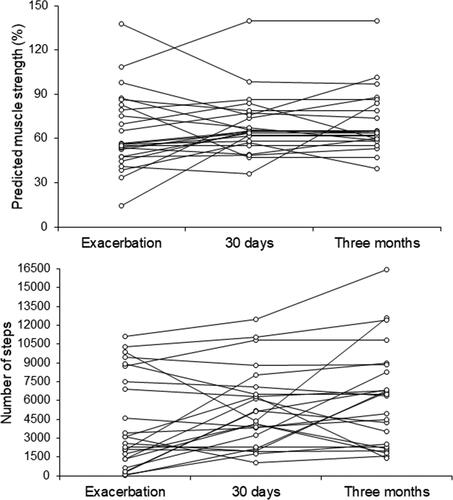
Table 2. Variation in the level of physical activity in exacerbation, 30 days and three month follow-up.
Table 3. Variation in quadriceps muscle strength on exacerbation, 30 days and three month follow-up.