Figures & data
Figure 1. Flow chart of patients included in the study.
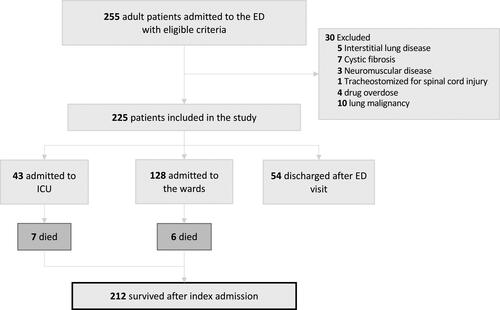
Table 1. Patients baseline and in-hospital characteristics.
Figure 2. Main diseases that can lead to AHRF in our population (n = 212). Each oval figure represents a disease; overlapping of figures indicates the presence of more than one disease. Areas in the figures represent the prevalence of the diseases. COPD = chronic obstructive pulmonary disease, CHF = congestive heart failure, OSA = obstructive sleep apnea, OHS = obesity-hypoventilation syndrome. Numbers in bold represent the total number in a given category.
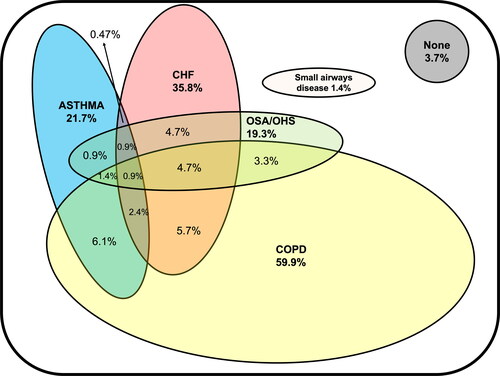
Table 2. Cumulative number of patients readmitted and deceased due to all causes at different times after discharge from index event (n = 212).
Table 3. Predictors of adverse outcomes (readmissions and death) at one year.
Figure 4. Kaplan-Meier curves comparing patients that received ventilatory support to the ones that didn’t receive ventilatory support.
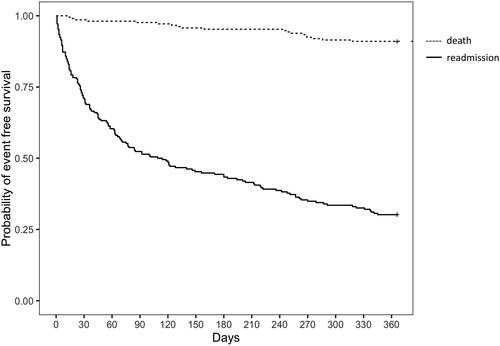
Figure 3. Kaplan-Meier curve of free-event survival at one year in the overall group.
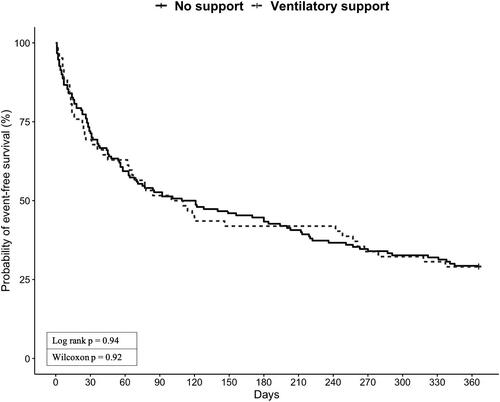
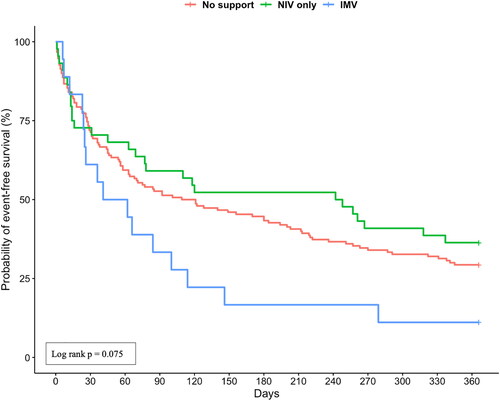
Figure 5. Kaplan-Meier curves comparing patients that received invasive ventilatory support (IMV), received only noninvasive ventilatory support (NIV only) and didn’t receive ventilatory support (no support).