
Figures & data
Table 1. Characteristics of participants.
Figure 1. Participants’ score on the Assessment of Life Habits (LIFE-H) domains: daily activities (nutrition, fitness, PC, communication, housing, and mobility) and social roles (responsibilities, IR, CL and recreation). Education and Employment were nonapplicable. Centre lines show the medians; box limits indicate the 25th and 75th percentiles; whiskers extend 1.5 times the interquartile range from the 25th and 75th percentiles, outliers are represented by dots. Abbreviations: PC: personal care; IR: interpersonal relationship; CL: community life. Weighted score ≤ 7 (vertical dashed line): experiencing difficulties or needing assistance to accomplish activities.
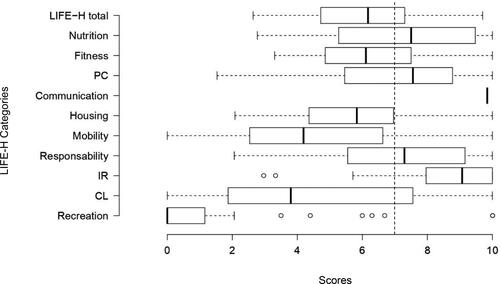
Table 2. Social participation, dyspnoea, exercise capacity, muscle strength, anxiety, depression, and quality of life.
Table 3. Associations between social participation and dyspnoea, exercise capacity, muscle strength, anxiety, depression, and quality of life (n = 57).
Table 4. Multiple linear regression models of factors associated with social participation as measured by LIFE-H.