Figures & data
Figure 1. Flow chart of study selection.
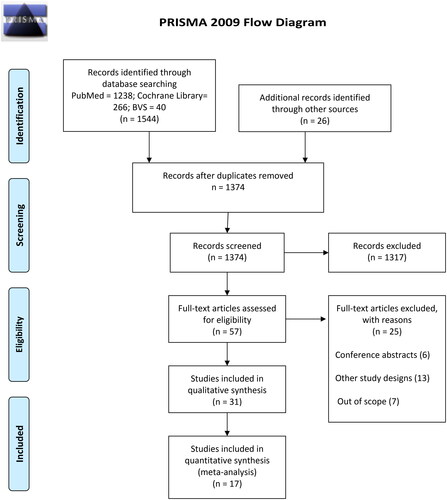
Table 1. Main methodological characteristics of the included studies.
Table 2. Characteristic of the interventions and the population enrolled in included studies.
Table 3. Clinical characteristics of the population enrolled in included studies.
Table 4. Characteristics of the intervention.
Figure 2. Mean difference (and 95% confidence interval) of dyspnea levels by CRQ/CRDQ between groups of HBPR (Home pulmonary rehabilitation) versus CG (Control group).
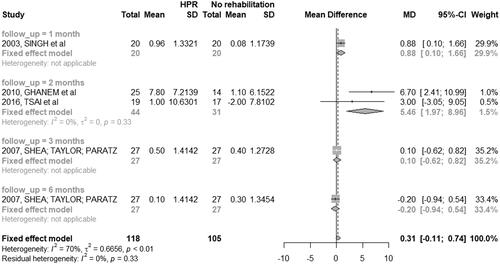
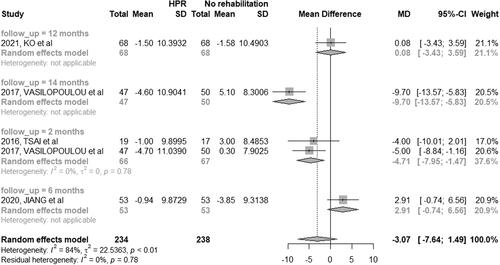
Figure 3. Mean difference (and 95% confidence interval) of dyspnea levels by MRC/mMRC between groups of HBPR (Home pulmonary rehabilitation) versus CG (Control group).
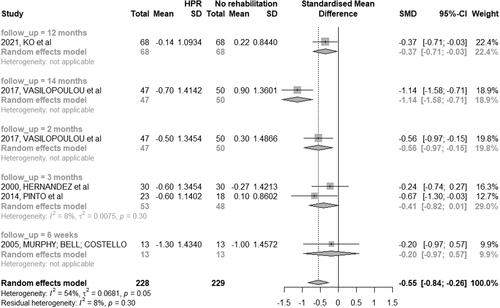
Figure 4. Mean difference (and 95% confidence interval) regarding the results of SPO2 between groups of HBPR (Home pulmonary rehabilitation) versus CG (Control group).
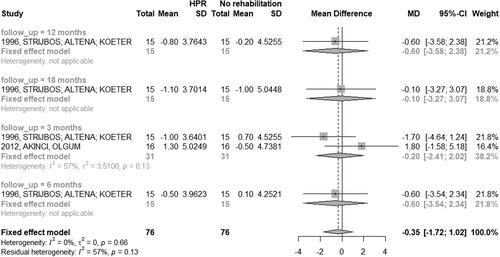
Figure 5. Mean difference (and 95% confidence interval) regarding the results of 6MWT between groups of HBPR (Home pulmonary rehabilitation) versus CG (Control group).
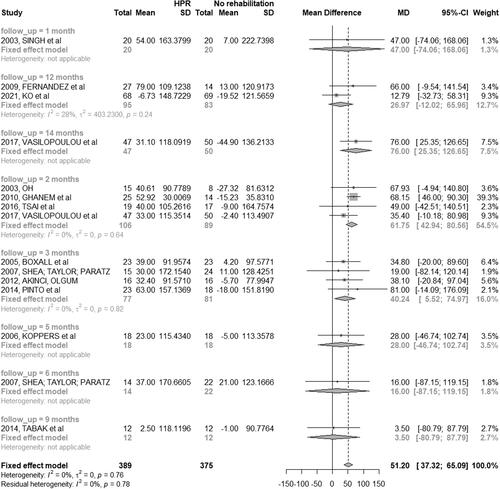
Figure 6. Mean difference (and 95% confidence interval) regarding the results of HRQoL by SGRQ between groups of HBPR (Home pulmonary rehabilitation) versus CG (Control group).
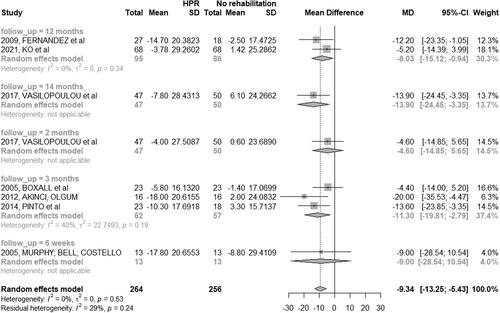
Figure 7. Mean difference (and 95% confidence interval) regarding the results of impact of the disease by CAT between groups of HBPR (Home pulmonary rehabilitation) versus CG (Control group).