
Figures & data
Figure 1. Allocation algorithm based on Burgel et al. for the PRAXIS (PS) and Rotterdam Study (RS) cohorts.
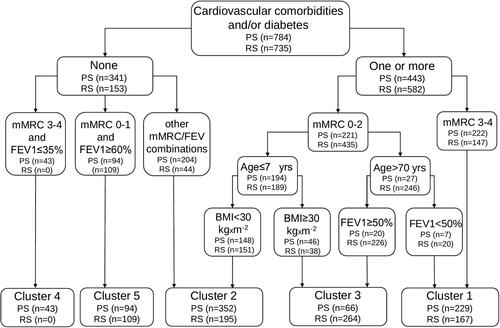
Table 1. Baseline characteristics of the clinical COPD phenotype groups (mean (SD) or % unless otherwise stated).
Figure 2. (A) Kaplan-Meier analysis for assessing all-cause mortality over the study period in the PRAXIS cohort. (B) Kaplan-Meier analysis for assessing all-cause mortality over the study period in the Rotterdam Study cohort.
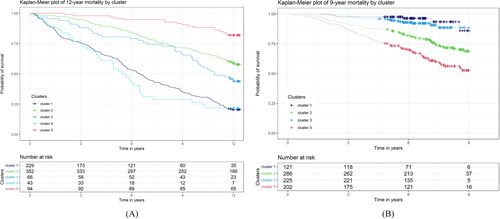
Table 2A. Baseline characteristics of the clinical COPD phenotype groups in the PRAXIS cohort (mean (SD) or % unless otherwise stated).
Table 2B. Baseline characteristics of the clinical COPD phenotype groups in the Rotterdam Study cohort (mean (SD) or % unless otherwise stated).
Table 3. Relative mortality risk, assessed using a Cox regression model in the PRAXIS and Rotterdam Study cohorts (hazard ratio (95% CI)).
Table 4. Relative mortality risk in clinical COPD clusters, assessed using a Cox regression model, adjusted for age and sex in the PRAXIS and Rotterdam cohorts (hazard ratio (95% CI)).
Table 5. Relative mortality risk in clinical COPD clusters, assessed using a Cox regression model, adjusted for age, sex and for short-term oral corticosteroid use during the last six months in the PRAXIS and Rotterdam Study cohorts (hazard ratio (95% CI)).
Table 6. Meta-analysis for relative mortality risk at 3 and 9 years, adjusted for age and sex. Cox regression model (HR, 95% CI).