
Figures & data
Table 1. Patients’ characteristics.
Table 2. Patients’ respiratory oscillometry characteristics.
Table 3. The coefficient of variation of multiple respiratory oscillometry measurements within a day.
Table 4. Univariable cox proportional hazard models to explore an association of physiological indices with a risk of future exacerbations.
Figure 1. Association between forced expiratory volume in 1 sec and inspiratory resonant frequency in patients with COPD and colored 3-Dimensional visualization of respiratory changes in reactance in GOLD group B patients.
(A) % of predicted forced expiratory volume in 1s (%FEV1) was associated with % predicted of resonant frequency at inspiration (%Fres-ins). The linear regression showed that 50% in %FEV1 corresponded to 135% in % Fres-ins. (B) Colored 3-Dimensional visualization of respiratory changes in reactance in GOLD group B patients with low inspiratory resonant frequency (Fres-ins, 70%, left) and high Fres (253%, right).
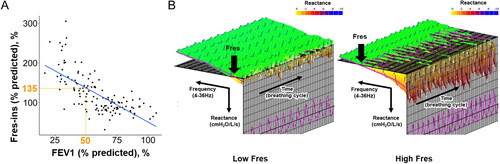
Table 5. Clinical and physiological comparisons between patients with high and low inspiratory resonant frequency.
Figure 2. Further categorization of the GOLD A and B groups using FEV1 and resonant frequency to compare the time to the first future exacerbation over 5 years.
(A) Based on a cutoff of 50% for % of predicted forced expiratory volume in 1 s (%FEV1), the GOLD A and B groups were further divided into Group A with high FEV1, Group A with low FEV1, Group B with high FEV1 and Group B with low FEV1. A Group C D indicates a combined group from the GOLD C and D groups. (B) Based on a cutoff for % predicted of resonant frequency at inspiration (%Fres-ins = 135%), the GOLD A and B groups were further divided into Group A with high Fres, Group A with low Fres, Group B with high Fres, and Group B with low Fres.
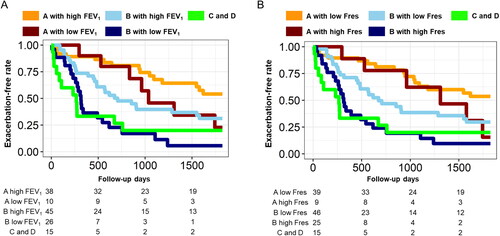
Table 6. Multivariable Cox proportional hazard models to explore relative contributions of baseline physiological impairments to future exacerbations.