Figures & data
Figure 1. COPD like lung function loss was found in rats exposed to cigarette smoke or motor vehicle exhaust. Male SD rats were exposed to cigarette smoke (CS) for 60 d in a whole body exposure chamber or motor vehicle exhaust (MVE) in an exposure system for 24 weeks. (A) The values of lung function parameters, including airway resistance, chord compliance, total lung capacity and the ratio of FEV50/FVC were determined. (B) Representative H&E staining images of rat tissues sections with or without CS or MVE exposure treatment. Each calculation for mean linear intercept (Lm) in lung was based on six rats and five representing slides across different regions of the lung from each rat. Data are represented as mean ± SEM (n = 6). **p < .01 for CS or MVE group versus respective CTL group; #p < .05 and ##p < .01 for CS group versus MVE group.
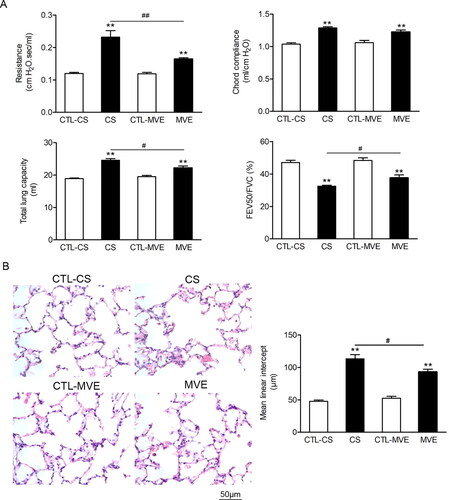
Figure 2. Cigarette smoke and motor vehicle exhaust exposure-induced inflammation and mucus hypersecretion in airway. The bronchial alveolar lavage fluid (BALF) was collected. (A) The cells in BALF were separated, subjected to H&E staining and differential counting. (B) The levels of IL-6 and TNF-α in supernatants of BALF were determined with ELISA. (C) The Muc5ac levels in BALF supernatants were determined with ELISA. (D) The PAS staining of lung sections and the PAS staining positive areas in bronchia were semi-quantitatively analyzed and presented as ratios to the total bronchial area. (E) Lung sections were subjected to H&E staining and the calculation of bronchial wall area ratio to the total bronchial area. The ratio analyses for PAS staining positive area or bronchial wall area were performed in six rats per group with five representing slides in each rat. Data are represented as mean ± SEM (n = 6). **p < .01 for CS or MVE group versus respective CTL group; #p < .05 and ##p < .01 for CS group versus MVE group.
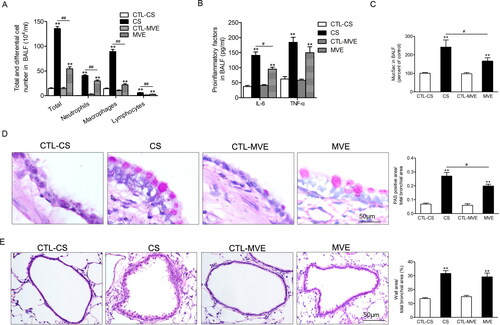
Figure 3. PD-L1 was increased in lung exposed to CS or MVE. The relative mRNA levels of PD-L1 in lung tissues were presented as percentage of the control group. (B) Protein levels of PD-L1 in lung tissues were determined by using western blotting. The blotted bands were relatively semi-quantitated to internal control (GAPDH) by densitometry and presented as relative amount to control groups. Data are presented as mean ± SEM. **p < .01 for CS or MVE group versus respective CTL group. (C) Representative images from lung tissue sections with immunofluorescence staining of PD-L1. Arrows indicated the cells with relatively brighter fluorescence staining than average.
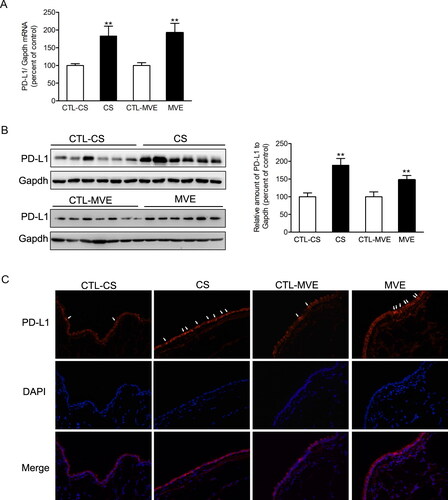
Figure 4. Cigarette smoke extract and PM2.5 reduced cell viability and induced proinflammatory cytokines production in airway epithelial cells. (A,B) Human normal bronchial cells BEAS-2B were incubated with 0–20% CSE or 0–300 µg/ml PM2.5 for 48 h. Cell viability was measured with CCK-8 kit and presented as percentage of control group. (C) BEAS-2B cells were incubated with 2% CSE or 100 µg/ml PM2.5 for 48 h. The levels of IL6 and IL8 in cell culture medium were determined with ELISA. Data are presented as mean ± SEM (n = 5). **p < .01 for CS or PM2.5 group versus respective CTL group; #p < .05 and ##p < .01 for CSE group versus PM2.5 group.
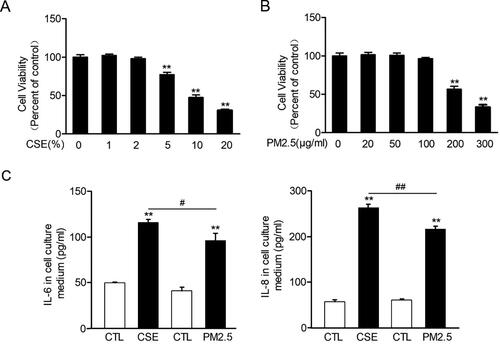
Figure 5. Cigarette smoke extract and PM2.5 induced PD-L1 increases in airway epithelial cells. BEAS-2B cells were incubated with 2% CSE or 100 µg/ml PM2.5 for 48 h. (A) The relative mRNA levels of PD-L1 were presented as percentage of the control cells. (B) Protein levels of PD-L1 were determined by western blotting. The blotted bands were relatively semi-quantitated to internal control (GAPDH) by densitometry and presented as percentage amount to control cells. Data are presented as mean ± SEM (n = 6). **p < .01 for CSE or PM2.5 group versus respective CTL group; #p < .05 and ##p < .01 for CSE group versus PM2.5 group. (C) Representative images from immunofluorescence staining of PD-L1 in cultured BEAS-2B cells.
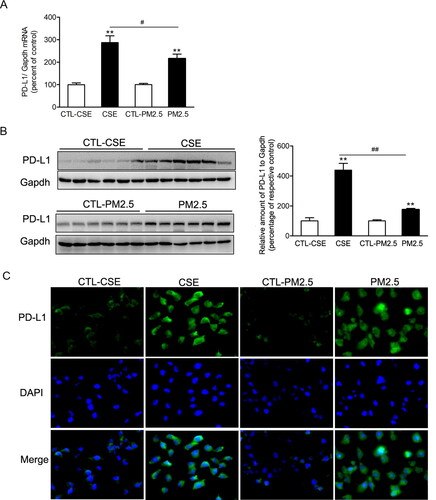
Figure 6. Phosphorylation of ERK and STAT in lung or BEAS-2B cells in respond to CS/CSE or MVE/PM2.5 treatments. Western blotting was used to determine the levels of total and phosphorylated ERK, STAT1 and STAT3 proteins in (A) lung tissues exposed to CS or MVE, or in (B) BEAS-2B cells treated with 2% CSE or 100 µg/ml PM2.5. For lung tissues, samples were randomly selected from six rats per group. The results for cell lysates were from one representative experiment performed in triplicates and repeated for three times. Relative semi-quantitation of the bands to internal control (GAPDH) was performed by densitometry. The ratios of phosphorylated protein to total protein were calculated and presented as percentage of respective control. Data are presented as mean ± SEM. *p < .05 or **p < .01 for CS/CSE or MVE/PM2.5 group versus respective CTL group; ##p < .01 for CS/CSE group versus MVE/PM2.5 group.
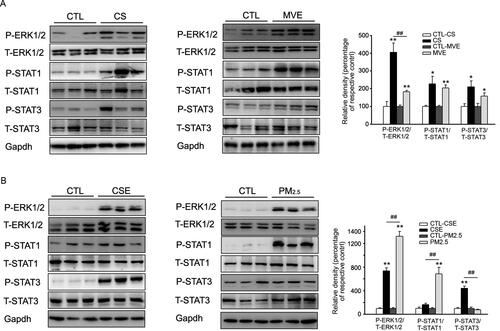
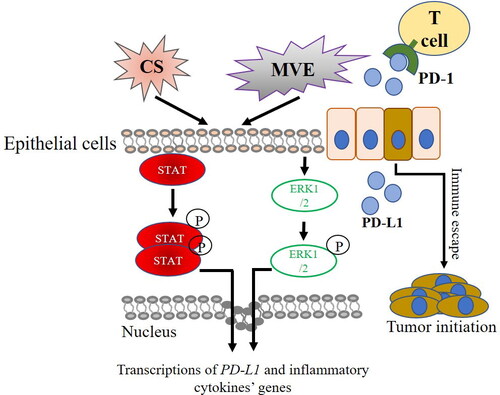
Figure 7. PD-L1 overexpression in COPD and lung cancer initiation. Compounds in CS or MVE activate STATs or EEK1/2-mediated pathways which trigger the overexpression of pro-inflammatory cytokines and PD-L1 in COPD. PD-L1 potentiates the initiation of lung cancer by promoting immune escape of cells bearing oncogenic mutation from T cells.