
Figures & data
Table 1. Age stratification of Brazilian deaths, COPD all mention, underlying cause and non-underlying cause of deaths, Brazil, 2000–2019.
Figure 1. COPD standardized mortality rates according to cause of death qualification, sex, and Brazilian regions, Brazil, 2000–2019.
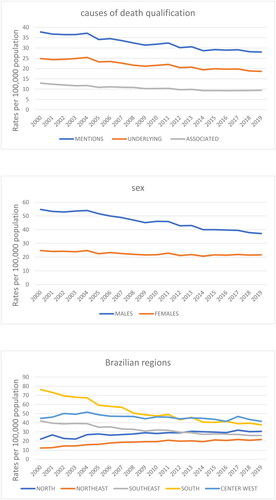
Table 2. Average age-adjusted mortality rates and annual percent change trends related to COPD by cause of death. Brazil, 2000 – 2019.
Figure 2. COPD-specific averaged mortality rates according to the cause of death qualification and age, Brazil, 2000–2019.
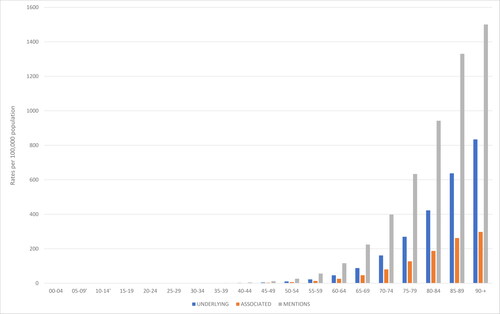
Table 3. Underlying causes of death that listed COPD in death certificates among males and females, Brazil, 2000–2019.
Table 4. Leading associated (non-underlying) causes on death certificates in which COPD was identified as the underlying cause (UC) or as an associated (non-underlying) cause, and total, Brazil, 2000–2019.
Figure 3. Number of deaths related to COPD, according to cause of death qualification and seasons of the year, Brazil, 2000–2019.
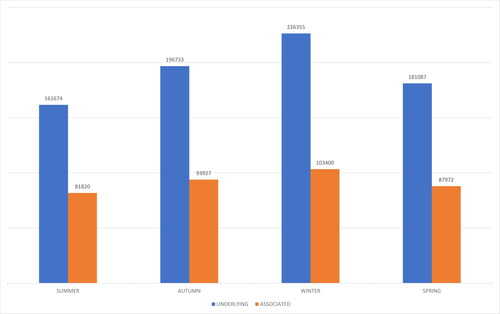
Table 5. Brazilian and COPD deaths, proportional mortality (PM) related to COPD according to season of the year and qualification or the cause of death, Brazil, 2000–2019.