Figures & data
Figure 1. Spirometry protocol for one measurement. BF = Breathing Frequency; MPT = Metronome-paced Tachypnea; IC = Inspiratory Capacity.
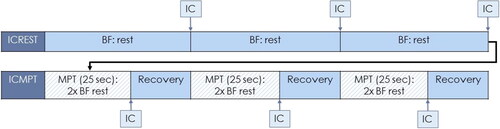
Table 1. Patients characteristics per subject.
Table 2. Mean ICREST and ICMPT, ΔIC and ΔIC% supervised and unsupervised. SD = Standard Deviation.
Table 3. Bias and limits of agreement for ICREST, ICMPT, ΔIC and ΔIC% from visits 2, 3 and 4.
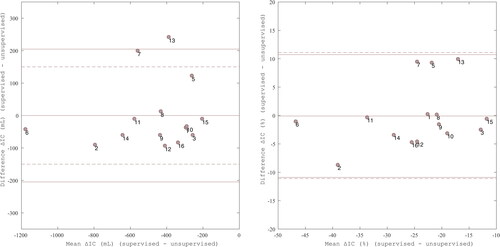
Figure 2. Bland Altman plot comparing ΔIC (mL) supervised and ΔIC (mL) unsupervised measured at visit 2 on right. Bias (solid) = –0.025 mL; Limits of agreement (solid) = upper: 0.252 mL, lower: –0.303 mL; Bland Altman plot comparing ΔIC% supervised and ΔIC% unsupervised measured at visit 2 on left. Bias (solid) = 1.57%; Limits of agreement (solid) = upper: 12.27%, lower: –15.41%; Threshold = 11.1% (dashed). Threshold = 150 mL (dashed). Regression lines (not displayed) were non-significant.
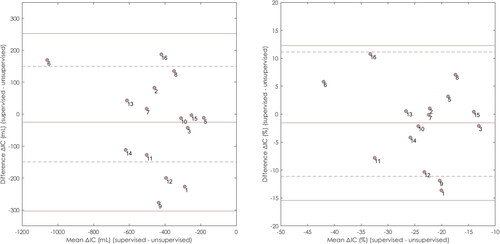
Figure 3. Bland Altman plot comparing ΔIC (mL) supervised and ΔIC (mL) unsupervised measured at visit 4 on right. Bias (solid) = 0.000 mL; Limits of agreement (solid) = upper: 0.205 mL, lower: –0.205 mL; Bland Altman plot comparing ΔIC% supervised and ΔIC% unsupervised measured at visit 4 on left. Bias (solid) = 0.09%; Limits of agreement (solid) = upper: 10.72%, lower: –10.89%; Threshold = 11.1% (dashed). Threshold = 150 mL (dashed). Regression lines (not displayed) were non-significant.