
Figures & data
Figure 1. The O2COMFORT Flowmeter, Oxypoint, Belgium.
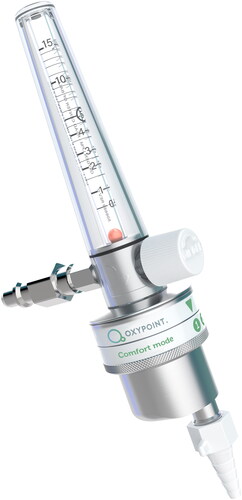
Table 1. Patient population.
Figure 2. Oxygen delivery in L/min based on the logged flow data of oxygen delivery to the respiratory ward in 132 patients treated with oxygen over a period of 12 weeks. Each data point represents a flow obtained over a 2 min time interval. Black indicates hybrid, gray indicates conventional flow meter periods. The horizontal lines represent the average O2 utilization in the respective periods.
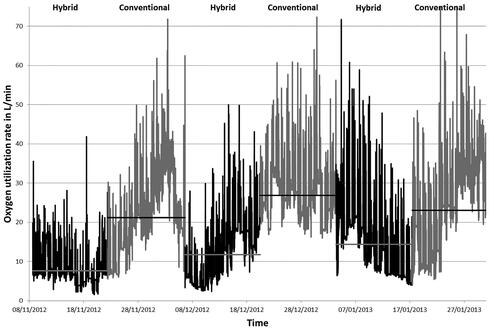
Table 2. Averaged oxygen consumption (L/min) of the ward measured by the datalogger and manually registered oxygen flow during each 6 consecutive periods.
Figure 3. Mean oxygen delivery in L/min during the conventional (dark gray), the hybrid (light gray) flow meter periods and after normalization for occupancy, O2 prescription and administration, and aerosolization. The oxygen sparing effect by 54% based on the mass flow meter logged data is reduced to 39% after normalization.
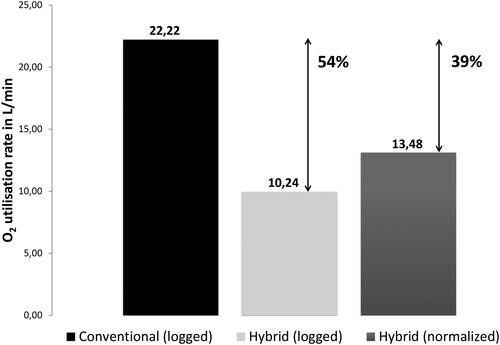
Table 3. Total and adjusted oxygen consumption (L/min) of the ward averaged over the 6 weeks period measured by the datalogger during the conventional and the hybrid weeks. Corrections for the hybrid weeks were made for bed occupancy, oxygen administration, and oxygen utilization in aerosol therapy.
Figure 4. Comparison between the relative humidity using continuous flow rates from 1 to 4 liters per minute and their equivalent on-demand flow settings 1 to 4. O = outlier 3rd quartile + 1.5 * interquartile range or 1st quartile -1.5 * interquartile range.
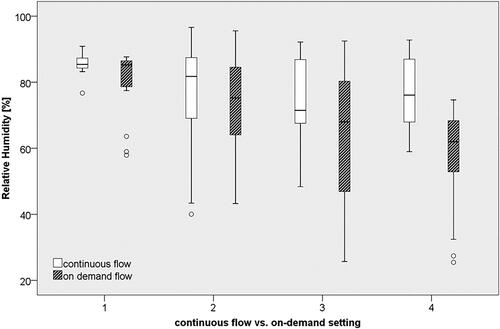
Figure 5. Comparison between the saturation levels using continuous flow rates from 1 to 4 liters per minute and their equivalent on-demand flow settings 1 to 4. O = outlier 3rd quartile +/- 1.5 * interquartile range or 1st quartile -1.5 * interquartile range; * = outlier 3rd quartile + 3 * interquartile range or 1st quartile - 3 * interquartile range.
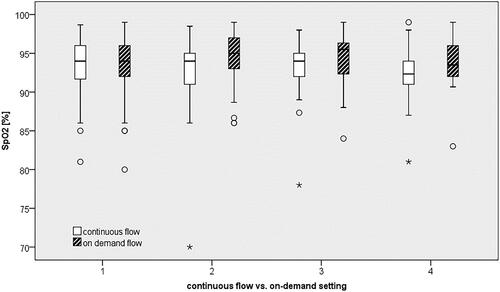
Table 4. Summary of average relative humidity (RH) between on-demand mode and continuous flow.
Table 5. Average saturation level between on-demand mode and continuous flow for different flow rates.
Table 6. Summary of average scores of the modified Wong-Baker pain scale for the on-demand mode and continuous flow. A low average score indicates more comfortable therapy. For further details: see text.