
Figures & data
Table 1. The summarized data indicating the primary, qualified, and differentially expressed probes in each biological sample.
Figure 1. Statistical comparison of AUCs among different biological samples based on the identified genes (* indicated significant difference at the level of 0.05, ** indicated significant difference at the level of 0.01, ***indicated significant difference at the level of 0.001).
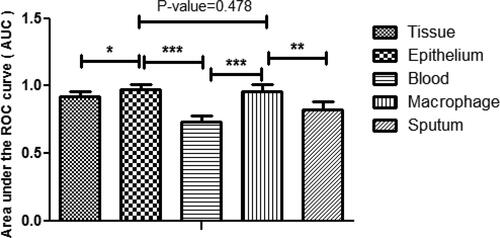
Table 2. Probes and corresponding 33 candidate genes by elastic-net penalized logistic regression model for the association between the genes with COPD progression.
Figure 2. (A) Expression level of CCR4, ITK, RPUSD2, RAB11B, OXNAD1, and GPR171 in lung tissue. (B) Expression level of BTBD19, THSD4, PPP4R4, NRG1, DNM3, ITGA6, D109, UHRF1, CST6, EPHB2, CDKN2A, KIAA1199, RGS20, and SH3RF2 in SAE. (C) Expression level of MTHFSD, CLEC7A, and VCAN in Blood. (D) Expression level of PTPN4, CCDC37, GABARAPL1, ADAMTSL1, ATOH8, SSBP1, and SRPX in macrophages. (E) Expression level of CHRFAM7A/CHRNA7, HSPA4, and CADM1 in sputum.
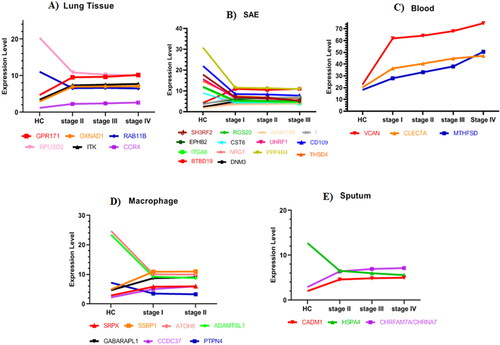
Figure 3. Spearman’s rank correlation, co-expression, matrix between the selected genes in the COPD patients: heatmap for hierarchical clustering the 33 candidate genes based on their pattern of gene expression.
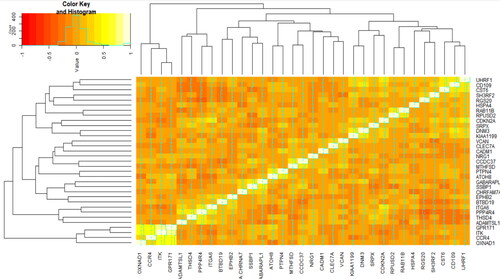
Figure 4. Co-expression network for the 33 selected genes from GeneMania. The size of the nodes indicates the co-expression degree between genes. The thickness of the edges indicates the weight of co-expression. The red-yellow color of the nodes/edges indicates the degree/weight, respectively.
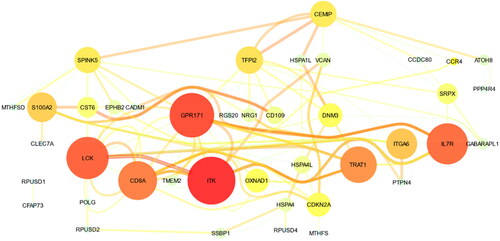
Table 3. Confirmation of the association of 33 selected genes with COPD/or lung function by literature reviewing in PubMed databank.
Figure 5. The path diagram: A diagram based on the connections between selected genes in the studied biological samples.
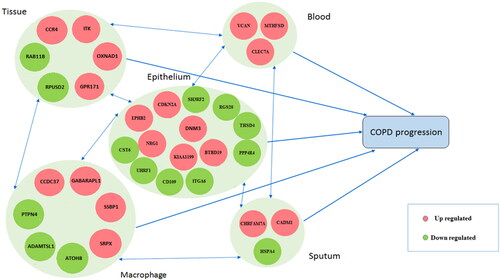
Table 4. Standardized direct, indirect, and total effects of selected genes in studied biological samples on COPD progression.
Data availability statement
Data sharing not applicable to this article as no datasets were generated or analyzed during the current study.