
Figures & data
Figure 1. The length of the QT interval was obtained by identifying the QRS onset and the point at which the downward slope of the T wave returns to baseline.
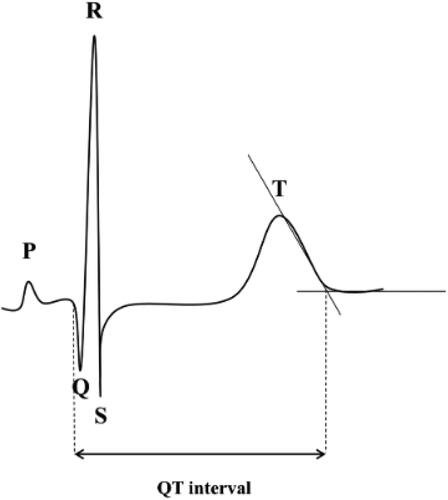
Figure 2. Study flow.
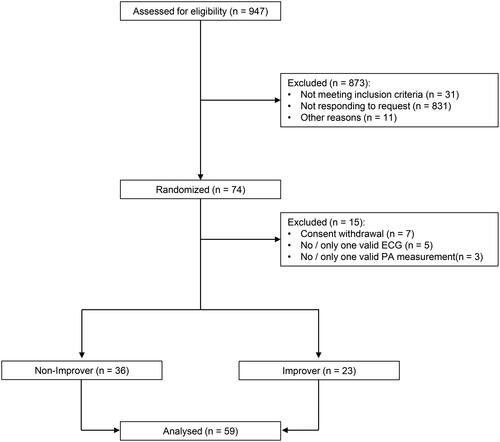
Figure 3. Boxplots showing QTc at baseline and 3 month follow-up visit in Non-Improver (difference from baseline to end of study -13 ms) and Improver (difference from baseline to end of study -27 ms), p-value for effect adjusted baseline QTc = 0.16. Data are mean (SD). Solid gray line: mean.
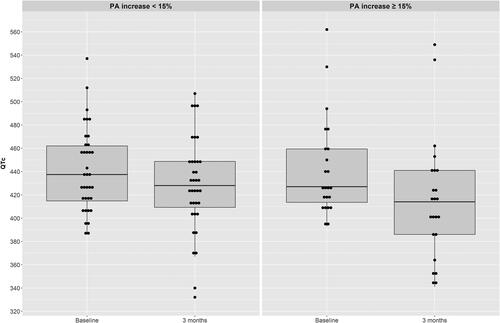
Table 1. Patients’ characteristics.
Table 2. Changes of QTc (Barzett) stratified according to the course of PA.