
Figures & data
Figure 1. Flow chart of study patients.
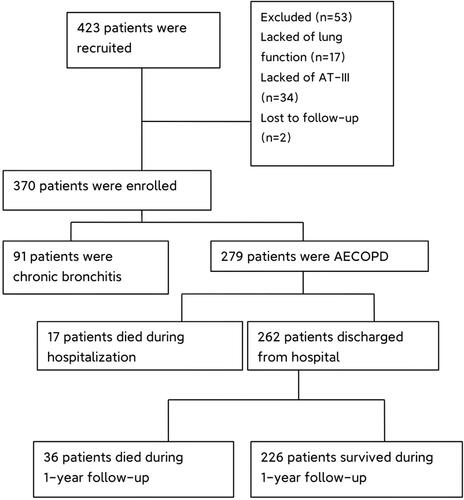
Table 1. Baseline characteristics of AECOPD and chronic bronchitis patients.
Table 2. The demographic and baseline clinical characteristics of Non-survivors group and survivors group.
Table 3. The demographic and baseline clinical characteristics of 1-year of deaths group and in-hospital deaths group.
Figure 2. ROC curve analysis to determine the efficacy of AT-III, D-dimer, CRP, and FIB in predicting all-cause mortality of AECOPD patients. The area under ROC curve (AUC) of AT-III was 0.75 (95% CI: 0.68–0.81, p < 0.001), FIB was 0.61 (95% CI: 0.53–0.69, p = 0.01), CRP was 0.68 (95% CI: 0.60–0.77, p < 0.001) and D-dimer was 0.79 (95% CI: 0.73–0.86, p < 0.001).
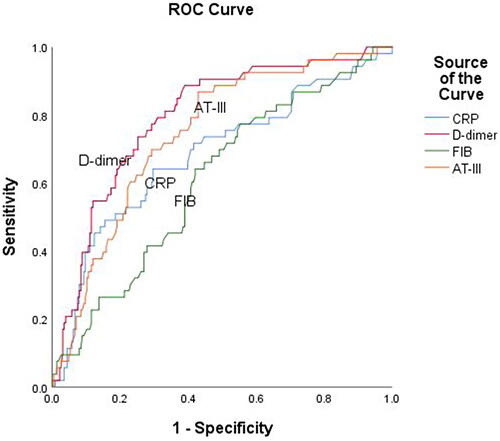
Figure 3. Used a combined marker approach involving AT-III, CRP, and D-dimer, an AUC of 0.82 was observed (95% CI: 0.76–0.88, p < 0.001), at a sensitivity of 81.10% and specificity of 75.00%.
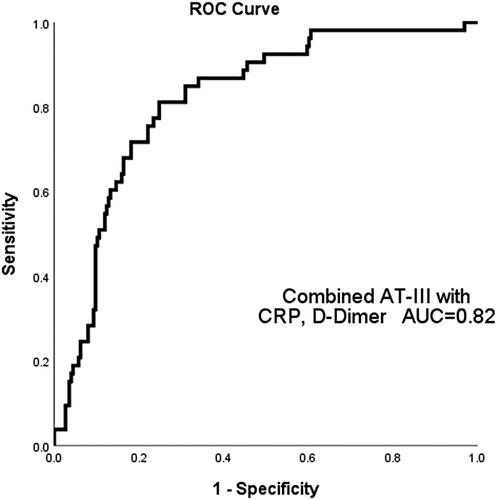
Figure 4. Kaplan–Meier survival curves evaluating the time to death in days for patients with AT-III >79.75% and AT-III ≤ 79.75%.
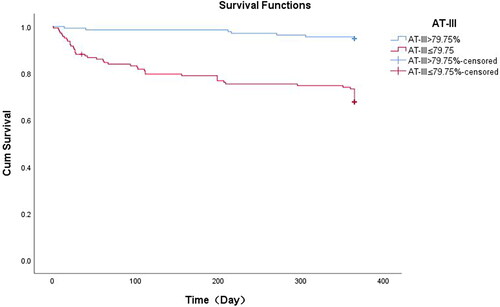
Table 4. Univariate and multivariatecox regression analyses of factors for all-causemortality.
Table 5. Univariate and multivariatecox regression analyses of factors for all-causemortality.
Supplemental Material
Download Zip (209.3 KB)Data availability statement
Data for this study are available from the corresponding author.