
Figures & data
Figure 1. Flow diagram for inclusion and exclusion of patients.
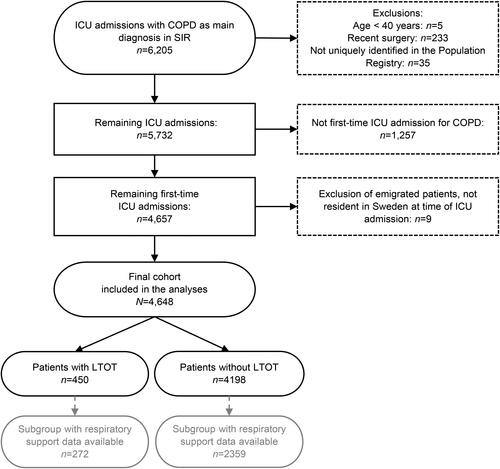
Table 1. Data on baseline characteristics at ICU admission, treatment, and outcomes.
Figure 2. Kaplan-Meier plots of survival stratified by (a) LTOT, and by (b) LTOT and sex with 95% CI (shaded areas).
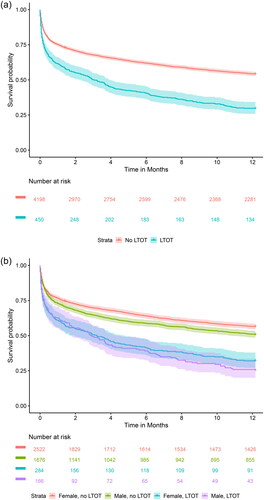
Table 2. Multivariable regression models for 30-day mortality and one-year mortality.
Table 3. Multivariable regression models including respiratory support on the subgroup of patients with complete data.
Supplemental material